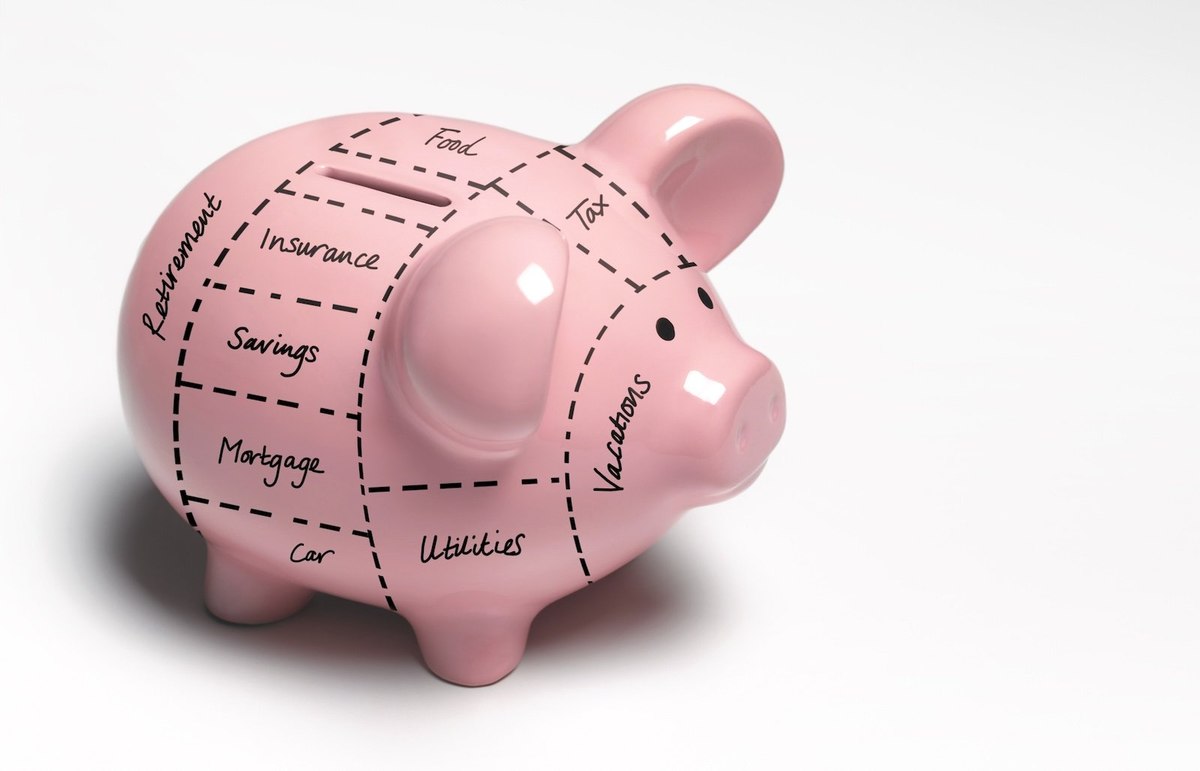
Vacation spending - food, accommodations take priority over shopping, transport
Lesley Simeon - September 12th, 2024
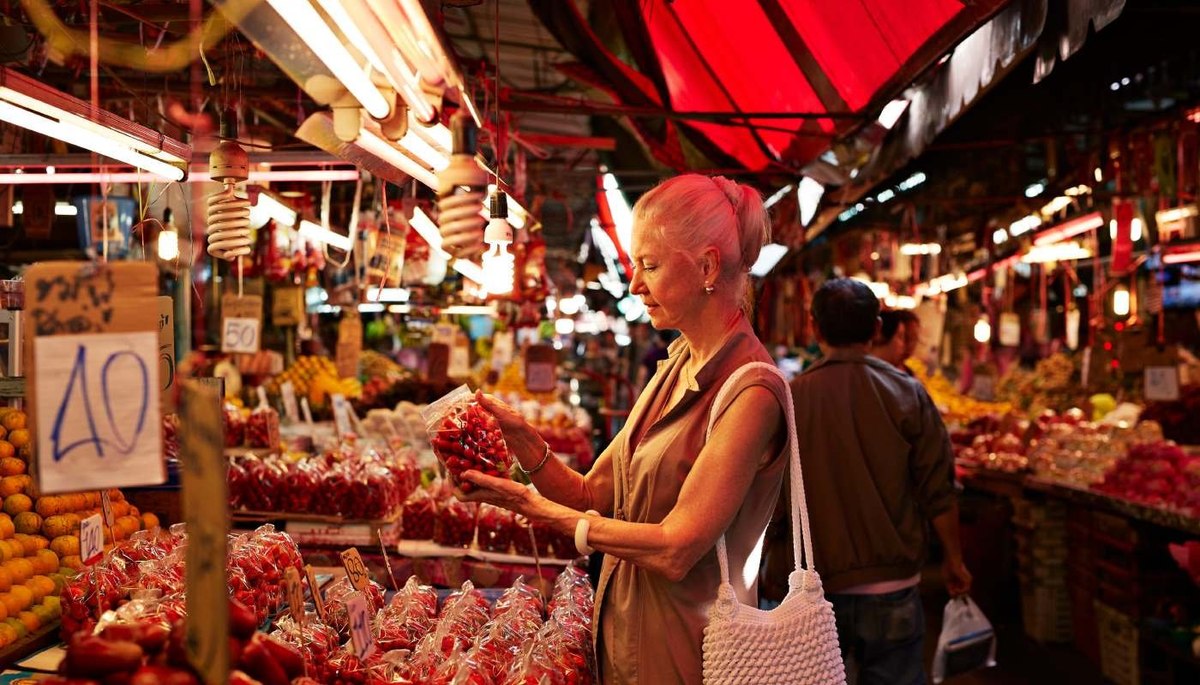
Vacations are a time to relax, explore, destress, and of course, splurge a little. Whether it's chasing a breathtaking sunset or indulging in a suite with a mountain view, holidays are often marked by the sneaky additions to vacation budgets.
In this piece, we’re exploring holidaymaker’s spending intent across different categories of products, services and experiences on their next vacation in the coming 12 months, compared to their previous ones within the last 12 months.
Data from YouGov Surveys: Serviced reveals that people are most likely to spend more on food/eating out (31%) on their next vacation compared to ones they’ve been on in the last 12 months. Activities/excursions (28%) and accommodations (28%) follow at second position.
Shopping (18%) is the vacation-time activity that could see less spends devoted to it, followed by transportation at destination (15%) and flights (15%).
A quarter of consumers expect to spend more on wellness-focussed activities during their next holiday (25%), while 14% expect to spend less on this category. But wellness is also the category travelers are most likely to spend about the same (39%) on their next holiday compared to last.
As for categories travelers expect to spend the same on during their next vacation, wellness activities top the list (39%), followed by shopping (38%). All but one category (flights at 30%), follow at third position - food/eating out, activities/excursions, accommodations, transportation at destination (37% each).
Vacation-time spending patterns by market
Travelers in India and the UAE account for the largest proportion of those across all markets surveyed who expect to spend more generously on all listed categories:
- Food/eating out (India 58%, UAE 54%)
- Accommodations (India 50%, UAE 47%)
- Transportation (India 54%, UAE 44%)
- Activities/excursions (India 57%, UAE 51%)
- Wellness (India 57%, UAE 53%)
- Shopping (India 56%, UAE 54%)
- Flights (UAE 46%, India 39%)
Focussing only on the European markets surveyed, Poles lead in spending more on several vacation-time pursuits:
- food/eating out (38%), accommodations (35%), transportation (27%), activities and excursions (35%) and shopping (35%).
While Brits are the most likely to spend more for spending more on flights (25%), Italians (20%) and Germans (18%) are most likely to spend more on wellness
In the US and Great Britian, travelers are most likely to increase spending on food/eating out (20% and 27% respectively) on their next vacation compared to their last.
Now for categories travelers’ expect to spend less on:
Indonesians lead across markets in spending less in several categories:
- Flights (23%, followed by travelers in France, Spain and the UAE at 18% each)
- Accommodations (18% for both Indonesians and the French)
- Transportation (22%), followed by Spanish (20%)
French are the most likely to spend less on food/eating out (21%), activities/excursions (19%, so are the Italians at 19%), wellness (21%) and shopping (at 30%, closely followed by Italians at 28%).
In the US, Americans are most likely to spend less on shopping (15%) and food/eating out (14%) on their next vacation. In Britian, travelers are most likely to cut back spending on shopping (13%).
Explore our living data - for free
Discover more travel and tourism content here
Want to run your own research? Run a survey now
Make smarter business decisions with better intelligence. Understand exactly what your audience is thinking by leveraging our panel of 26 million+ members. Speak with us today.
Methodology: YouGov Surveys: Serviced provide quick survey results from
nationally representative or targeted audiences in multiple markets. The data is based on surveys of adults aged 18+ years in 17 markets with sample sizes varying between 511 and 2051 for each market. All surveys were conducted online in January 2024. Data from each market uses a nationally representative sample apart from Mexico and India, which use urban representative samples, and Indonesia and Hong Kong, which use online representative samples. Learn more about YouGov Surveys: Serviced.
Photo by Uriel Mont on Pexels
Related Content
ARTICLE
1 day ago
Divided outlook: How Americans see the economy—and their wallets—in 2025
ARTICLE
1 day ago
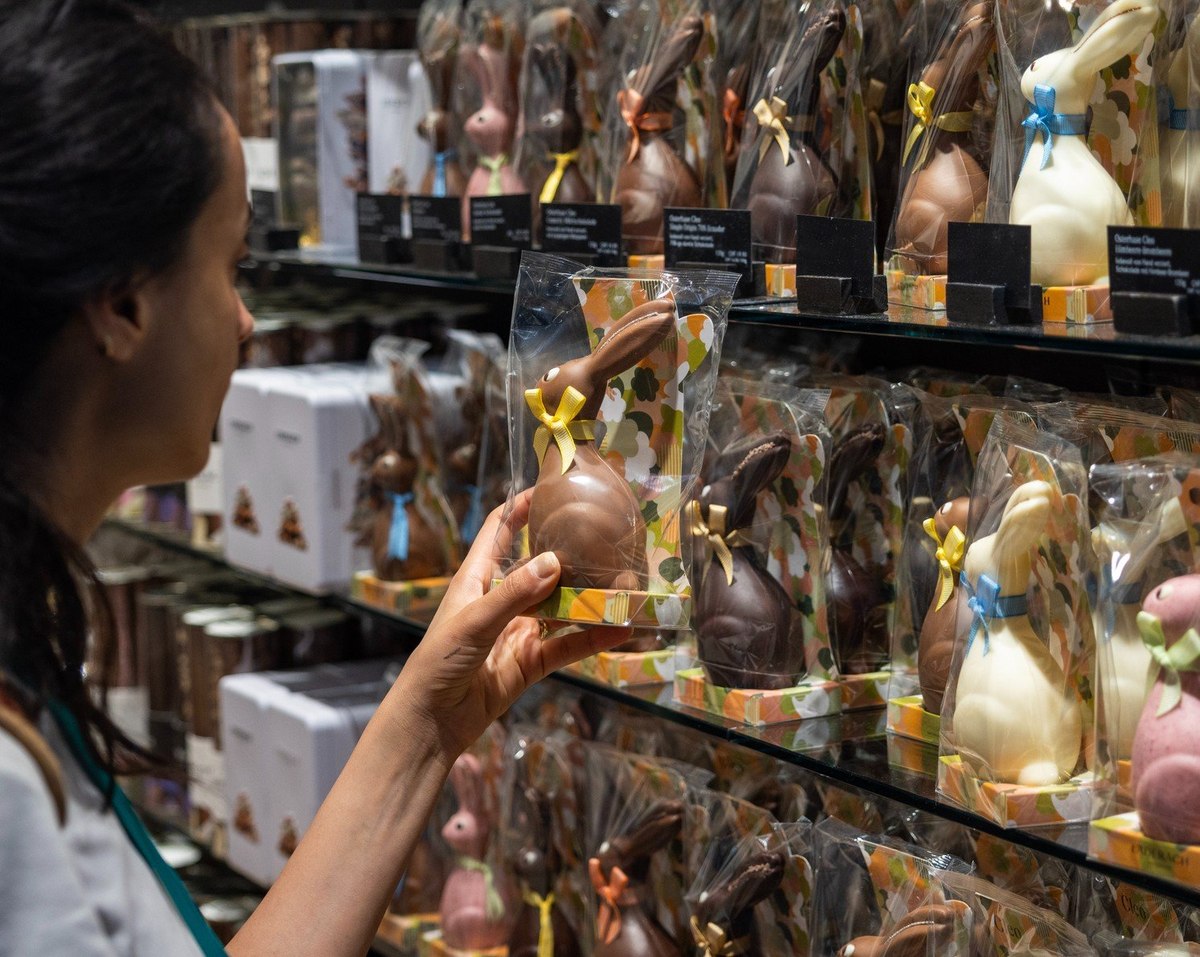
How Britons plan to celebrate Easter 2025

ARTICLE
1 day ago
70% of US special occasion shoppers say price drives special occasion purchases

ARTICLE
1 day ago
What influences UK shoppers to buy seasonal ranges
ARTICLE
4 days ago
A deep dive into British customer service preferences
ARTICLE
5 days ago
What’s driving interest in niche tourism? New data from YouGov explores traveler motivations


ARTICLE
9 days ago
What’s behind the rise of duped makeup products?


ARTICLE
19 days ago
How ready are UK businesses for new ESG rules?

ARTICLE
22 days ago
How the UK Plans to Celebrate Mother’s Day in 2025

ARTICLE
27 days ago
Understanding TV ownership and screen size preferences in UK homes

ARTICLE
27 days ago
Nearly half of Britons concerned about wearable tech privacy


ARTICLE
about 1 month ago
Majority of Britons celebrate Shrove Tuesday, with pancakes as the main tradition

ARTICLE
about 2 months ago
Ramadan 2025: How non-mudik crowds in Indonesia plan to spend their time and money

ARTICLE
about 2 months ago
Ramadan 2025: Travel plans, traditions, and booking trends for mudik

ARTICLE
about 2 months ago
Ramadan 2025 – How Indonesians plan to spend and give this festive season
ARTICLE
about 2 months ago
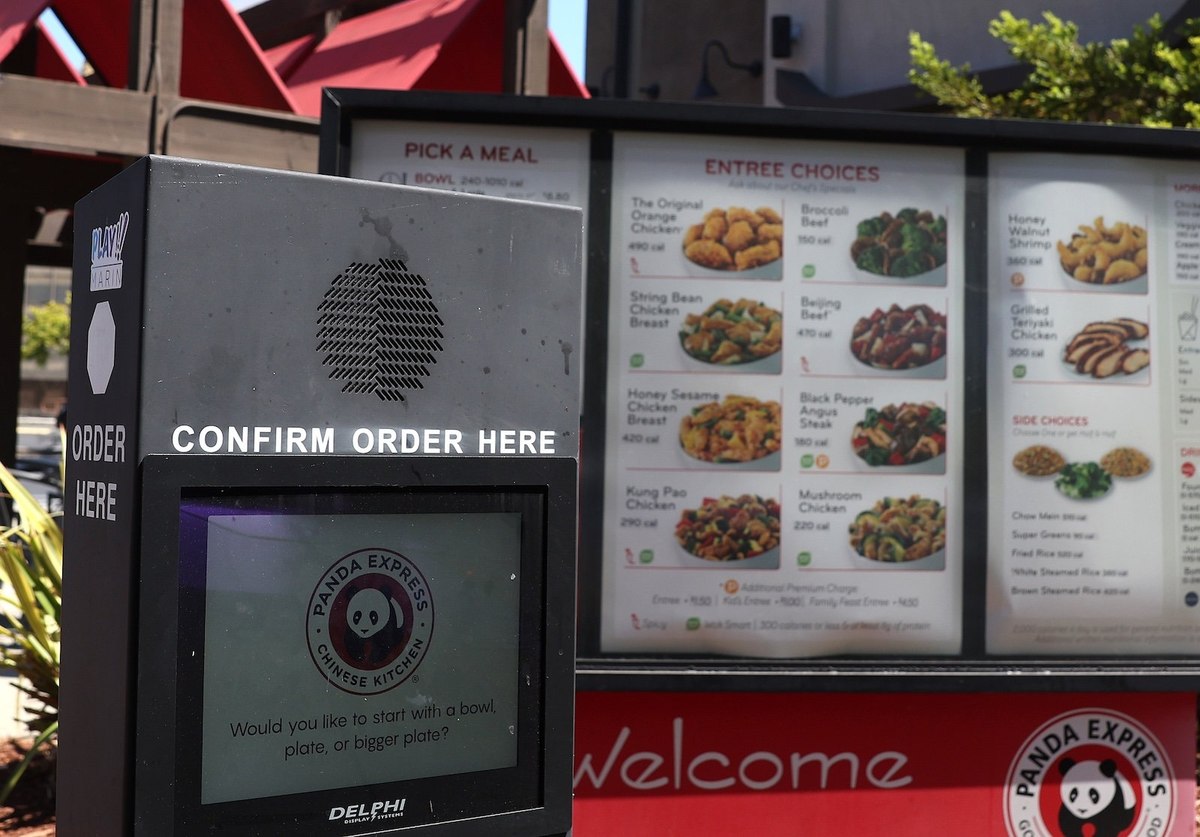
America doesn’t want AI chatbots in their drive-thrus, but they may change their minds

ARTICLE
about 2 months ago
YouGov/Cebr consumer confidence index registers biggest drop in retrospective business activity measures since the start of the pandemic

ARTICLE
about 2 months ago
DEI another day?

ARTICLE
about 2 months ago
How many Brits are consuming energy drinks, protein shakes, and probiotic beverages regularly?
ARTICLE
about 2 months ago
Valentines Day 2025: How are Britons celebrating?


ARTICLE
3 months ago
American fast food: who’s eating what and where’s the best service?

ARTICLE
3 months ago
How will Trump 2.0 affect international travel intentions to the US?


ARTICLE
3 months ago
UK food and beverage trends and insights: 2024