A deep dive into British customer service preferences
Clifton Mark - April 8th, 2025
- Email and phone are the most preferred and most used ways to contact businesses.
- Digital channels like chatbots, apps, and social media are used but rarely preferred.
- Younger consumers favour live chat, while older generations still prefer phone calls.
- Restaurants, supermarkets, and hotels lead the way in customer service satisfaction.
- Satisfaction is highest among younger adults and higher-income households.
When Britons contact a business, they want to do it by phone or email. Despite the expansion of digital tools like chatbots and mobile apps, few would use them if they had the choice.
New data from YouGov Profiles and a YouGov Surveys: Serviced sheds light on how Britons navigate customer service, which sectors are getting it right, and which consumers are most satisfied with their experiences. From age and income differences to standout industries, the results reveal a nuanced picture of customer expectations in 2025.
Most-used vs. most-preferred customer service channels
Email (33%) and phone (31%) are the most widely preferred channels for contacting customer service. They’re also the most widely used, with 74% of Britons tending to contact businesses by email and 65% doing so by telephone.
However, the data suggests that many are being forced into channels they would not freely choose. Only 1% of Britons say they prefer to use chatbots, though 18% report using them. Apps (2% preferred vs. 13% used) and social media (1% preferred vs. 11% used) also suffer from limited enthusiasm.
These gaps suggest that while businesses may be pushing customers toward lower-cost or automated digital options, many consumers continue to gravitate toward human-centric communication like email or phone—when given the choice.
Generational and income-based divides in customer service preferences
Preferred channels vary considerably by age. Younger Britons are more digitally inclined, with 15% of Gen Z preferring live chat (compared to just 2% of the Silent Generation) and 3% favouring social media. However, they are also more likely to avoid contacting businesses altogether—11% of Gen Z say they never do so, nearly double the national average of 6%.
Older generations overwhelmingly prefer phone contact, with half of Silent Generation respondents naming it their top channel, compared to just 16% of Gen Z. Email, on the other hand, sees relatively stable preference across age groups, though it peaks among Gen X (36%) and dips among the Silent Generation (24%).
Income also plays a role. Britons with household incomes above £100,000 are more likely to prefer digital-first methods, including live chat and email, while lower-income households tend to rely more on traditional contact channels such as the phone.
Which sectors deliver the best customer service?
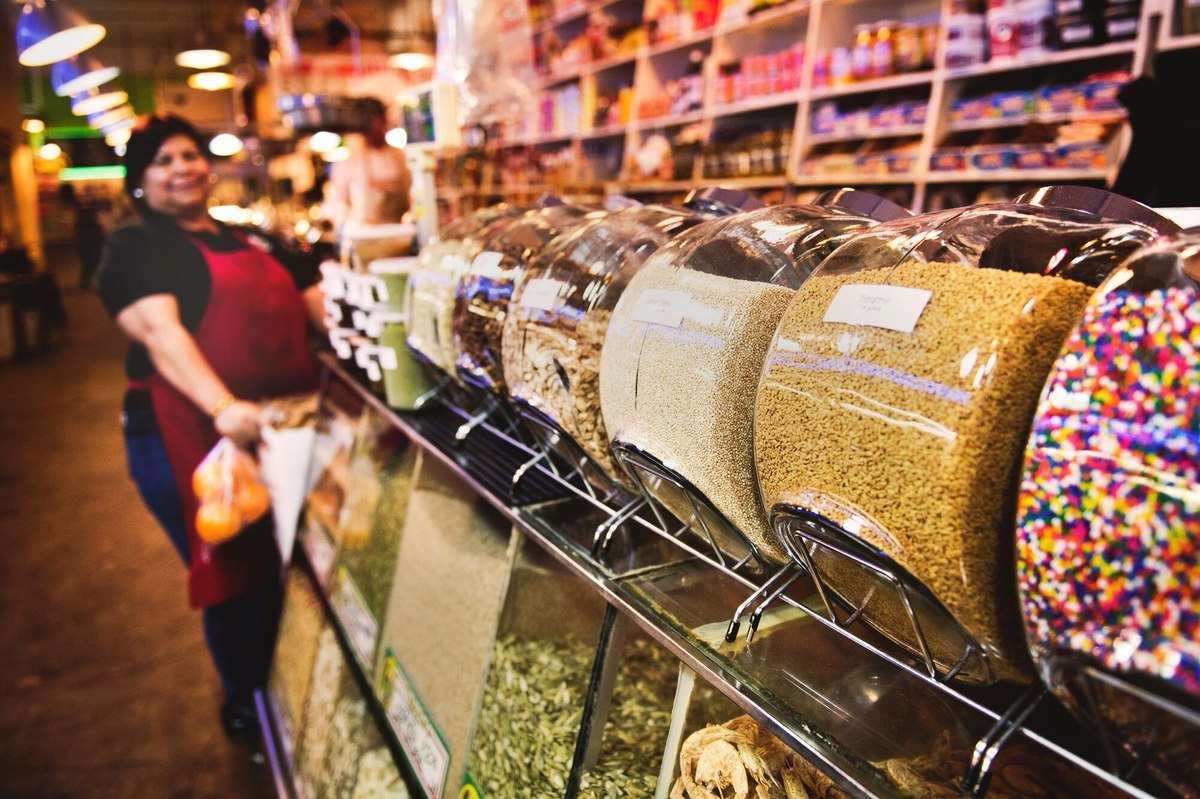
When asked to rate their customer service experiences, Britons were most satisfied with hospitality and food-related industries. Restaurants and cafes, supermarkets, and hotels top the list, with 76%, 74%, and 73% respectively rating service as either "very" or "fairly" good.
Entertainment venues like cinemas and theatres (71%) and bars or pubs (71%) also receive high marks. Online retailers (64%) and clothing retailers (62%) perform reasonably well, while tech, telecoms, and utilities fare worse in comparison.
Internet providers (51%), mobile networks (55%), and train services (46%) are among the lowest-rated, with over 20% of Britons describing their experiences with train companies as either "fairly" or "very" bad. Insurance providers and tech support services also receive mixed reviews, with satisfaction scores below the national average.
Which demographics are happiest with their customer service?
Overall, 60% of Britons rate customer service across sectors as either "very" or "fairly" good. But younger adults are significantly more positive. Among 18- to 24-year-olds, 73% express satisfaction, including 28% who say service is "very good." Satisfaction decreases steadily with age, dropping to 52% among those 55 and older.
Income also has a strong influence. Britons in households earning more than £100,000 per year are the most satisfied overall, with 75% rating customer service positively and only 9% rating it negatively. Those earning below that threshold are less enthusiastic, aligning more closely with the national average.
Gender differences are modest: men and women report similar satisfaction levels, though women are slightly more likely to rate service as "fairly good" and less likely to rate it "very bad." Men, by contrast, leave more ratings of “very good” or “very bad.”
While businesses increasingly invest in digital service solutions, British consumers continue to express a clear preference for personal, responsive customer support—most often via email or phone. Satisfaction remains highest in industries where service is delivered face-to-face, such as restaurants and hospitality. Meanwhile, digital-native sectors and infrastructure providers lag behind, suggesting that convenience alone doesn’t always translate to quality experiences.
Related Content
ARTICLE
2 days ago
Gen Z says the ’90s were peak style—and these are the brands that prove it

ARTICLE
2 days ago
Who’s eating what? The demographic divide behind Britain’s favourite cuisines

ARTICLE
2 days ago
Easter 2025 travel plans: Who’s travelling, where they're going, and what they’ll spend


ARTICLE
5 days ago
Divided outlook: How Americans see the economy—and their wallets—in 2025
ARTICLE
5 days ago
How Britons plan to celebrate Easter 2025

ARTICLE
5 days ago
70% of US special occasion shoppers say price drives special occasion purchases

ARTICLE
5 days ago
What influences UK shoppers to buy seasonal ranges


ARTICLE
8 days ago
What’s driving interest in niche tourism? New data from YouGov explores traveler motivations


ARTICLE
12 days ago
How often do Americans use streaming subscriptions?

ARTICLE
12 days ago
Theme parks in Britain – Who’s going and how often?

ARTICLE
12 days ago
What’s behind the rise of duped makeup products?

ARTICLE
12 days ago
Most UK adults prefer glasses over contact lenses – Here’s why

ARTICLE
12 days ago
How many apps do Americans download?

ARTICLE
12 days ago
Who’s really buying the tech at home? Research shows it depends on income, gender and household size

ARTICLE
13 days ago
UK retail store closures climb but in-person shopping still holds appeal in key categories


ARTICLE
20 days ago
What makes British Samsung Galaxy owners different from other smartphone owners?

ARTICLE
20 days ago
Who buys Ben & Jerry’s?

ARTICLE
22 days ago
Are Americans ready to trust AI with their health insurance?

ARTICLE
22 days ago
Retail store closures rise but in-person shopping still holds strong

ARTICLE
22 days ago
How ready are UK businesses for new ESG rules?

ARTICLE
26 days ago
How the UK Plans to Celebrate Mother’s Day in 2025


ARTICLE
about 1 month ago
Can Poundland bounce back, or will shoppers look elsewhere?
ARTICLE
about 1 month ago
Understanding TV ownership and screen size preferences in UK homes

ARTICLE
about 1 month ago
Challenges faced when cancelling mobile, broadband and streaming services

ARTICLE
about 1 month ago
What drives diners? How price, cuisine, and ethics shape restaurant choices