Are women watching calories in their drinks?
Sonika Choubey - March 25th, 2022
Women are more likely than men to track calories as well as try a new brand with lower calorie content
With concerns around health intensifying due to the coronavirus pandemic, YouGov’s latest survey shows nearly two-thirds of urban Indian respondents (65%) say it is extremely or somewhat important for them to know the calorie content in alcoholic beverages.
This information is more important to millennials as compared to the other age groups (at 71%). Among the genders, men who consider wine their favourite drink are more likely to say calorie content is important than those who prefer any other alcohol. However, among women, both wine and beer lovers are equally likely to say this, much more than those loving other types of alcoholic beverages.
Specifically for beer lovers, women are more likely than men to seek this information, indicating their likeliness to expand their palate with low calorie alternatives of beers.
When it comes to popularity of alcoholic beverages, beer is the most popular drink in India. More than half of urban Indians claim they have tried beer and a quarter call it their favourite drink. Beer is the most popular drink among men, followed by whisky and wine. However, for women, wine takes the top spot, followed by beer and vodka. Although wine consumption in India is low, preference is high among women, possibly because of their emphasis on making healthier drinking choices.
Among those who consider beer a favourite, a large majority (86%) claim to be occasional drinkers, either drinking on special occasions (birthday, etc), socially or only on weekends. In comparison to this, regular drinkers (who drink anytime, daily or most evenings in the week) are far fewer (22%). But between the genders, women are more likely than men to say they drink beer regularly.
Most popular occasions to drink beer are casual settings such as watching a favourite sport, binge-watching a series or when casually spending time with friends or family.
When it comes to loyalty, 38% of beer lovers said they have a favourite brand and like to stick to it. Half (49%) however are open to trying other options despite having a favourite brand. 13% have no preference and are open to everything.
From the popular drinks, stickiness to a favourite brand is higher among those who consider wine their favourite drink as compared to the rest. However, for women, this behaviour is more visible among female beer lovers, much more than men (42% vs 36%). This presents a great opportunity for brands looking to target female consumers with new variants, as they are more likely to respond to extensions of brands they have a preference for.
Data shows a better sensorial experience may encourage beer lovers who consider themselves brand loyalists (have a favourite and like to stick to it) to try a new brand (38%). This is followed by branding and competitive price (33% and 20%, respectively). One in twelve (8%) may try a new brand if it had lower calorie content- a bigger motivation for women as they are twice more likely than men to say this (11% women vs 5% men).
Among switchers as well (those who are either open to new options or have no preference), a better sensorial experience is the biggest motivation, far exceeding other options. A notable one in ten (10%) consider lower-calorie variants an important influencer, highlighting the increased emphasis on health and fitness among alcohol drinkers in the country.
Commenting on this, Deepa Bhatia, General Manager, YouGov India, said, “Beer is a widely enjoyed alcoholic beverage across genders and age groups in India. The increased focus on health post the pandemic has made people more aware of their choices and they are seeking healthier options. Women, particularly millennials, are leaning towards no alcohol or low-calorie variants presenting a huge growth opportunity for the beer market. Understanding their preferences will help brands strengthen consumer connect and drive growth within this sector.”
**This article is part of a series on understanding the changing alcohol preferences of urban Indian consumers. The data was collected online among 1058 respondents in India by YouGov’s Omnibus between February 8th – 11th, 2022 using YouGov’s panel of over 20 million people worldwide.
Related Content
ARTICLE
12 days ago
Gen Z says the ’90s were peak style—and these are the brands that prove it

ARTICLE
12 days ago
How clean are Brits? New YouGov survey reveals hygiene habits

ARTICLE
15 days ago
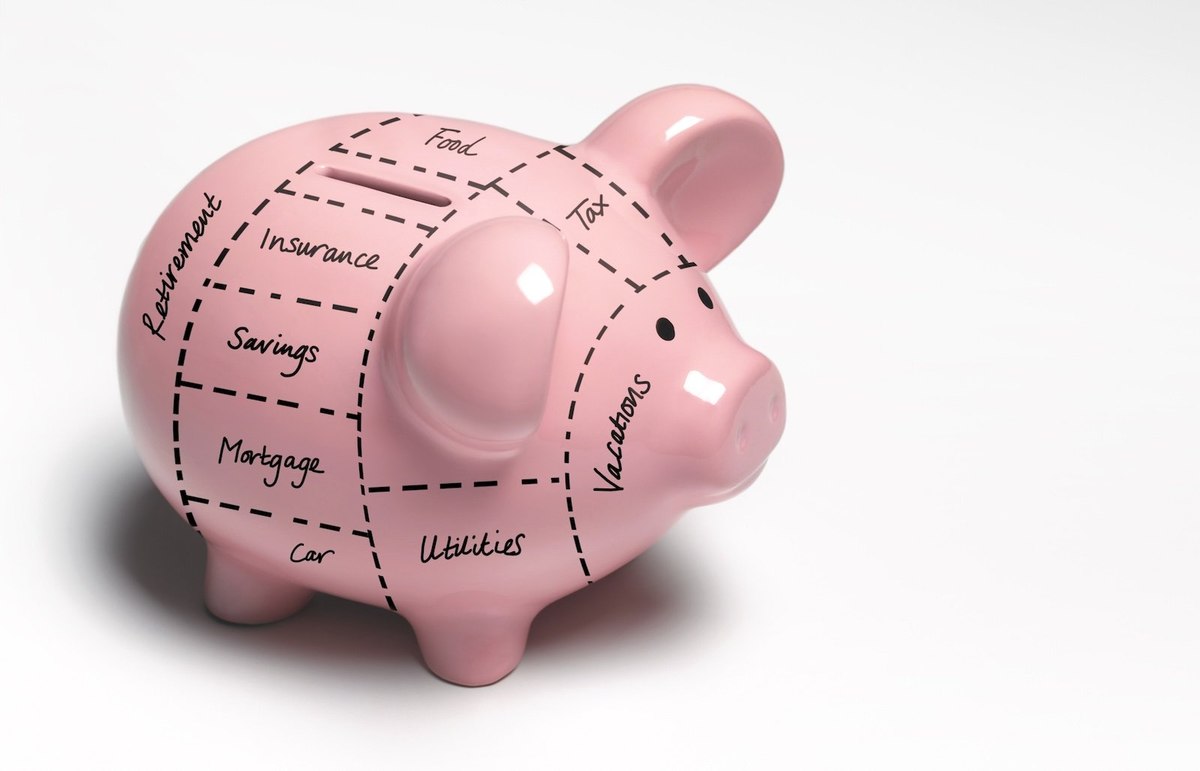
Divided outlook: How Americans see the economy—and their wallets—in 2025
ARTICLE
15 days ago
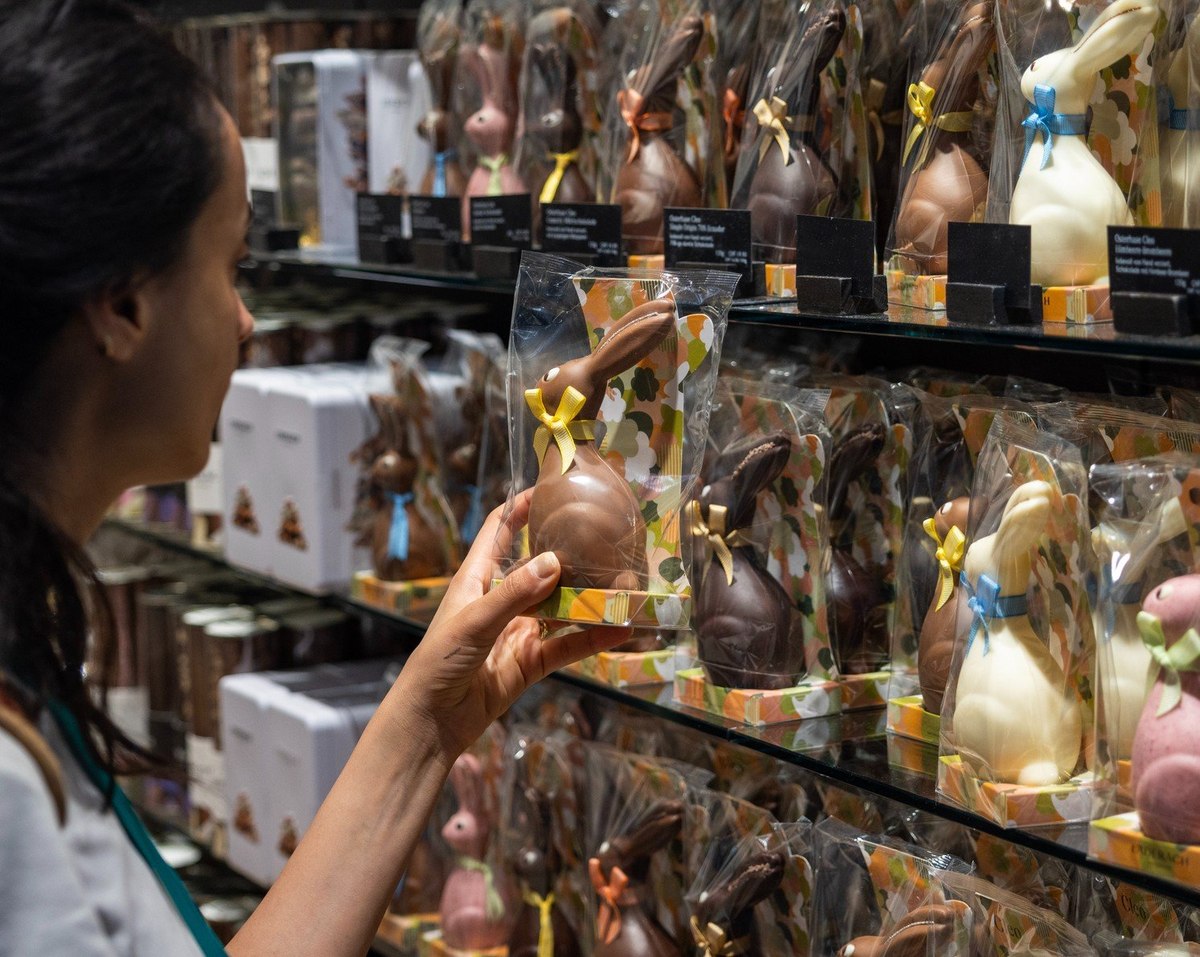
How Britons plan to celebrate Easter 2025

ARTICLE
15 days ago
70% of US special occasion shoppers say price drives special occasion purchases

ARTICLE
15 days ago
What influences UK shoppers to buy seasonal ranges
ARTICLE
18 days ago
A deep dive into British customer service preferences

ARTICLE
22 days ago
What’s behind the rise of duped makeup products?


ARTICLE
about 1 month ago
How ready are UK businesses for new ESG rules?

ARTICLE
about 1 month ago
How the UK Plans to Celebrate Mother’s Day in 2025

ARTICLE
about 1 month ago
Understanding TV ownership and screen size preferences in UK homes

ARTICLE
about 1 month ago
Nearly half of Britons concerned about wearable tech privacy


ARTICLE
about 2 months ago
Exploring the appeal of betting subscriptions that offer parlay boosts among US bettors

ARTICLE
about 2 months ago
Ramadan 2025: How non-mudik crowds in Indonesia plan to spend their time and money

ARTICLE
about 2 months ago
Ramadan 2025: Travel plans, traditions, and booking trends for mudik

ARTICLE
about 2 months ago
Ramadan 2025 – How Indonesians plan to spend and give this festive season


ARTICLE
2 months ago
DEI another day?
ARTICLE
2 months ago
Valentines Day 2025: How are Britons celebrating?


ARTICLE
3 months ago
Super Bowl LIX: America's Mixed Sentiments as Chiefs Aim for Historic Three-Peat


ARTICLE
3 months ago
UK food and beverage trends and insights: 2024
ARTICLE
3 months ago
Health and wellness roundup: Trends and insights for the UK in 2024
ARTICLE
4 months ago
UK retail trends and insights – A comprehensive overview for 2024

ARTICLE
4 months ago
US health and wellness trends - A comprehensive overview for 2024