Global: How much are consumers intending to spend on clothes and beauty products in the new year?
Among other things, the new year brings with it new consumer choices. But what do the plans of consumers look like in 2022? We asked the public in 17 markets across the globe whether they plan to spend more, less or the same across a range of categories this year.
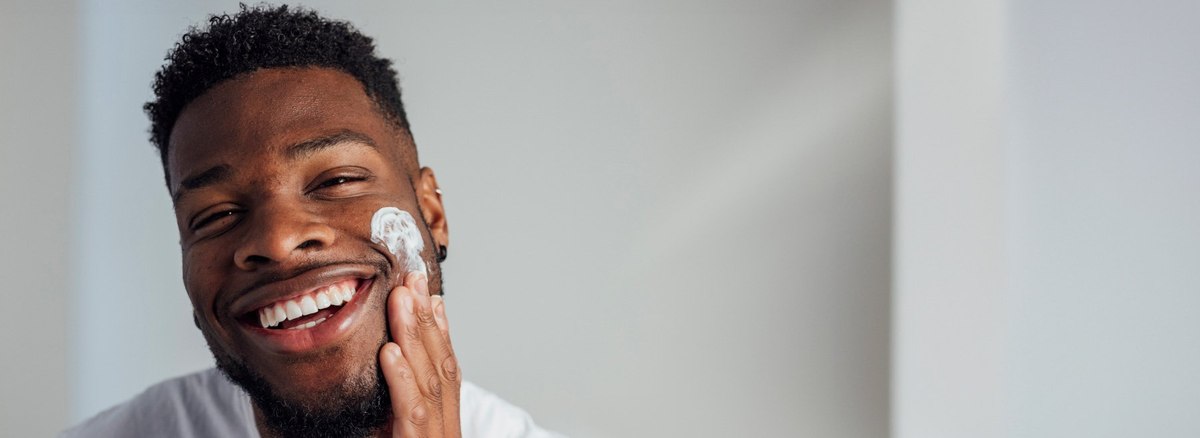
Around one in five global consumers say they intend to spend less on beauty products (18%) and clothes (21%)
Across each category we asked about, the most common answer was ‘about the same’ when it came to spending plans for 2022 compared to 2021. But overall, people are looking to save money (or at least not spend it in the usual ways) - in every category, consumers told us that they plan to spend less in 2022 than they did in 2021.
Beauty/personal care products and clothes/accessories have some of the lowest shares in which consumers intend to spend less in 2022 compared to other categories, while a majority intend on spending about the same (beauty products 61% and clothes 57%).
Spending on personal care products
A third of the online Indonesian community (31%) and urban Indians (30%) intend on spending more on beauty products in 2022, the highest share among all 17 markets. More than half of consumers in 14 of the 17 markets are planning to spend around the same amount in this category in 2022 as they did in 2021, with almost three-quarters of Danes saying the same.
Singapore has the highest share of consumers who plan to spend less on beauty products at 27%, followed by a quarter of French consumers (25%).
Like overall global consumers, around three in five Americans and the same proportion of Brits also plan to spend about the same on personal care products in 2022. However, a higher share of consumers from these two markets indicate that they intend to spend less (18% in US and 19% in GB) in 2022 compared to those who intend to spend more (9% in US and 4% in GB). The data further reveals that among American consumers with a propensity to spend more, 18-24-year-olds are the likeliest to plan to do so (24% of them say they plan on spending more), with a steady decline between the other age groups – 16% of 25-34, 10% of 35-44, 5% of 45-54 and 5% of 55+. On the other hand, the 18-24-year-old group and the segment of those over 55 years both have a similar share of consumers who intend to spend less on beauty products.
Spending on clothes and accessories
Like shopping for beauty products, a majority of overall global consumers intend to spend about the same on clothes and accessories (57%), and the share of those intending to spend less (21%) is also higher than the proportion of those who intend to spend more (17%).
Across all 17 markets, urban Indians are revealed to be the most likely to plan to spend more on clothes and accessories in 2022 (41%) - and by some way. They are followed by Indonesians (29%). At least one in ten consumers from all 17 markets intend on spending more on clothes and accessories this year while around a half of the consumers in each individual market say they intend on spending about the same.
A third of Singaporean consumers (35%) reveal that they plan to spend less in 2022; this is the highest share among all markets. France comes in next, with 28% saying they intend to spend less.
Age seems to be an indicator of overall consumer spending habits. Consumers aged 18-24 (32%) are twice as likely to plan to spend more on clothes in 2022 than 35-44-year-olds (16%). Similarly, the trend continues between consumers aged 45-54 (14%) and those aged 55+ (7%). Unsurprisingly, the opposite is true for those intending to spend less with the older consumers making up a higher share – 14% of 18-24-year-olds, 16% of 25-34, 19% of 35-44, 21% of 45-54 and 27% of 55+.
Receive monthly topical insights about the retail industry, straight to your inbox. Sign up today.
Discover more retail content here
Start building a survey now with YouGov Direct
Methodology: The data is based on the interviews of adults aged 18 and over in 17 markets with sample sizes varying between 511 and 2,628 for each market. All interviews were conducted online in November 2021. Data from each market uses a nationally representative sample apart from Mexico and India, which use urban representative samples, and Indonesia and Hong Kong, which use online representative samples.


