
The impact of image order and respondent instructions on subjective image ratings
Mireya Arteaga - March 19th, 2025
Summary and takeaway
The results of this Methodology matters experiment indicate that the order in which images are presented and whether rating instructions are provided can significantly impact ratings when respondents are asked to evaluate images. However, this study did not find significant impacts for varying features of images holding constant their overall quality (in this case, the presence or absence of a smile in images of faces).
Introduction and background
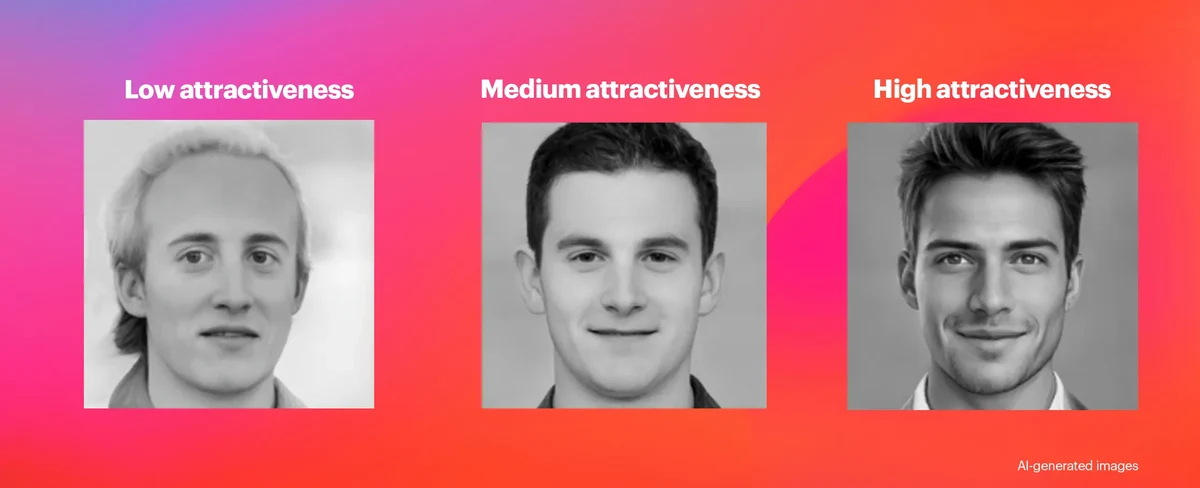
Assessing the attractiveness or appealingness of images poses challenges due to the subjective nature of these ratings. This experiment varies the presentation of photographs and whether or not instructions on using the rating scale were shown to respondents. In this experiment, we use images of men at varying levels of attractiveness generated from “Generated.Photos” (a generative AI model), and ask respondents to imagine they were women on a dating website when evaluating each image.
We had three primary aims in designing this study: 1) to evaluate the extent to which features of an image impact ratings overall, 2) to better understand how the order in which images are shown to respondents might impact their later ratings, and 3) to investigate how the instructions given to respondents might impact their usage of the provided scales.
>View experiment's disclosure statement
Experimental setup
The experimental setup involved presenting participants with sets of AI-generated images of men, either all smiling or unsmiling, in a randomized order. Each participant viewed three images: one high, one medium, and one lower attractiveness-rated image. The images were presented in a randomized order, and respondents were also randomly assigned to receive instructions on how to use the provided scales or not. The experimental design yields four primary comparison groups (setting aside the order in which the images were shown for the moment):
| Instructions given | No instructions given | |
|---|---|---|
Smiling photos | Group A | Group C |
Unsmiling photos | Group B | Group D |
The instructions for each group were as follows: (Note that bold is for instructions that were excluded for no instructions group): “For the next few questions, we'd like you to rate a series of images of men. Please put yourself in the position of a woman who is on a dating website interested in finding a romantic partner. Take a moment and try to imagine a person who is very attractive and would be rated at the top of the scale. Do the same for a very unattractive person who would be rated at the bottom of the scale. For each image, please use the provided scales.”
For each image, respondents were presented with two 0 to 20 scales: "How physically attractive would a woman on a dating site find this person?" and "How interested would a woman on a dating website be to find out more about this person?"
Participants (3,218 U.S. adults aged 18 and older) were recruited through YouGov’s proprietary panel.
Research hypothesis
Going into this experiment, we had the following hypotheses (for additional detail, see our preregistered research design):
- H1: Men with "low" attractiveness scores will be rated less appealing regardless of smile/neutral expression.
- H2: Smiling in photographs positively affects attractiveness and interest most for men with “medium” or “low” attractiveness ratings.
- H3: Respondents who see a low attractiveness image first will rate subsequent images higher (and vice versa for respondents who see a high attractiveness image first).
- H4: The impact of order will be mitigated by respondent instructions.
Data
To test these hypotheses, we ran a six item survey on a national sample of approximately 3,000 US adults. All respondents in the survey saw one photograph at a time and answered two questions each:
"How physically attractive would a woman on a dating site find this person?" and "How interested would a woman on a dating website be to find out more about this person?" These questions were asked in the third person to make them applicable to people of all sexual orientations.
Method
To test, we used a z-test comparing the means between respondent segments with a 95% confidence interval for the following hypotheses:
- Men with "low" attractiveness scores will be rated less appealing regardless of smile/neutral expression. We compared the attractiveness ratings of smiling “low” attractive men to those with higher attractiveness to assess significant differences.
- Smiling in photographs positively affects attractiveness and interest most for men with “medium” or “low” attractiveness ratings. We evaluated whether the relative increase in attractiveness ratings for smiling was greater for men with low attractiveness compared to those with “medium” and “high” attractiveness.
- Respondents who see a low attractiveness image first will rate subsequent images higher. We compared the average attractiveness scores of “medium” and “high” attractive men when shown first or second to a man of “low attractiveness”.
- The impact of order will be mitigated by respondent instructions. We assessed the influence of instructions by comparing attractiveness ratings from those asked to conceptualize attractiveness to those who were not.
Descriptive statistics
Attractiveness ratings by image quality: Overall, we see a very substantial difference in average ratings by the quality of the image. On average, the high quality images were rated at 14.3, the medium quality images about 3 points lower at 11.3 and the low quality images were rated lowest at an average rating of 7.
The presence or absence of a smile did not substantially (or consistently) impact attractiveness ratings. People rated the high quality smiling image somewhat lower compared to the high quality unsmiling image. There was a small increase in average attractiveness for the smiling medium quality image compared to the unsmiling image, and there was very little difference in the low-quality image.
Results
Hypothesis 1: Men with "low" attractiveness scores will be rated less appealing regardless of smile/neutral expression
| Expectation | P-value | Result |
|---|---|---|
Smiling men with “low” attractiveness will be rated significantly less attractive than smiling “medium” attractive men | < .001 | Directionally correct, and statistically significant |
Smiling men with “low” attractiveness will be rated significantly less attractive than unsmiling “medium” attractive men | < .001 | Directionally correct, and statistically significant |
Smiling men with “low” attractiveness will be rated significantly less attractive than smiling “high” attractive men | < .001 | Directionally correct, and statistically significant |
Smiling men with “low” attractiveness will be rated significantly less attractive than unsmiling “high” attractive men | < .001 | Directionally correct, and statistically significant |
The differences in attractiveness rating between men in the “low” attractiveness category compared to those in the “medium” and “high” attractiveness were all statistically significant. This difference held for both smiling and unsmiling comparisons across all other levels of attractiveness
Hypothesis 2: Smiling in photographs positively affects attractiveness and interest most for men with “medium” or “low” attractiveness ratings.
| Expectation | P-value | Result |
|---|---|---|
The relative increase in attractiveness ratings for smiling is higher in men with “low” attractiveness will be larger than smiling “medium” attractive men | < .001 | False, low-attractiveness men have a negative % change on attractiveness ratings when smiling v medium men. Low-attractiveness men < medium men (-1% v. 4%) |
The relative increase in attractiveness ratings for smiling is higher in men with “low” attractiveness will be larger than smiling “high” attractive men | < .001 | True, both have a negative % change on attractiveness ratings when smiling, with high attractive men having a larger impact. Low-attractiveness men > high men (-1% v. -3%) |
The relative increase in interest ratings for smiling is higher in men with “low” attractiveness will be larger than smiling “medium” attractive men | < .001 | False. Low attractive men have a negative impact on perceived interest when smiling v medium men. Low-attractiveness men < high men (-2% v. 5%) |
The relative increase in interest ratings for smiling is higher in men with “low” attractiveness will be larger than smiling “high” attractive men | .084 | False, both low-attractiveness men have a negative impact on perceived interest when smiling, with high attractive men having a higher decrease. Low-attractiveness men v. high men (-2% v. -3%) |
The impact of smiling was not significant, however men who are either high or low attractiveness had the largest impact on their perceived attractiveness and interest based on their expression (smiling or unsmiling).
Hypothesis 3: Respondents who see a low attractiveness image first will rate subsequent images higher (and vice versa)
We expect that the order images are presented to respondents will impact their ratings. We expect this to primarily operate through a “contrast” effect where the respondent is implicitly comparing each subsequent image they rate to the one that preceded it. Operationally, this means that people who rate a lower quality image first will rate subsequent images higher than average compared to individuals who rated a higher quality image first (and vice versa).
The table below shows the differences between the ratings of each image when they were shown first (which establishes the baseline). Each cell in the table shows the difference between the baseline rating (the average rating among those who saw the image first) and the rating that came after seeing a different image. For example, the second row, first column of the table shows a non-significant difference between people who rated the medium quality image first and those who rated it after seeing the low-quality image.
The results are mixed and not consistently in line with a contrast effect.
As expected, there was a positive difference for people who rated the medium and high images after the low-quality image (though the difference does not reach statistical significance). Contrary to expectations the ratings of the low quality images actually increased when contrasted with the higher quality images. The effect was not significant when respondents first saw the medium-quality image, but was significant when respondents first saw the high-quality image. The largest difference was observed in the difference between people who rated the high-quality image first compared to those who rated the high-quality image after seeing the medium quality image. Again contrary to our “contrast” effect expectations, the ratings of the high-quality image were lower after seeing the medium-quality image.
Hypothesis 4: The impact of order will be mitigated by respondent instructions.
We expected that explicitly providing respondents with instructions as to how to use the scale (in this experiment, getting them to imagine images that would be rated at the top and the bottom of the scale) would mitigate the impact of the order in which the images were presented. As the table below shows, there were fewer significant differences between the baseline measurements and those that were shown after another image. Perhaps a more substantial effect would be seen with a different set of instructions.
General discussion
While the results of this experiment were somewhat mixed, our findings show that researchers should take care when having respondents evaluate images. The order in which images are presented can significantly impact how respondents rate images. Randomization can solve some of these problems, but researchers should investigate potential “spill-over” effects when having participants rate images. Providing instructions prior to rating may mitigate the impact of order somewhat, but this is another area where more research is necessary.
About the author
Mireya Arteaga is the founder of Human Stories LLC, specializing in understanding human behavior, motivations, and decision-making. With 15 years of research experience, she combines qualitative and quantitative methods to deliver actionable insights for businesses of all sizes. She holds a degree in economics from the University of California at Santa Cruz and is the incoming president of the West Coast Insights Association. Based in Santa Cruz, California, Mireya is known for her resourcefulness, excelling at working within small budgets to deliver impactful, data-driven results. In her spare time, she enjoys playing drums.
About Methodology matters
Methodology matters is a series of research experiments focused on survey experience and survey measurement. The series aims to contribute to the academic and professional understanding of the online survey experience and promote best practices among researchers. Academic researchers are invited to submit their own research design and hypotheses.