
Comparing slider scales to textboxes for survey responses
Elizabeth Simas - October 7th, 2024
Summary and takeaway
The results of this experiment provide evidence that when compared to slider scales, textboxes result in responses that trend toward the lower end of the scale. In addition, individuals presented with textboxes used fewer unique numbers and gave less accurate responses to questions with objectively correct answers. These findings highlight important considerations for survey design and suggest that researchers should take care when comparing responses from different question modes.
Introduction and background
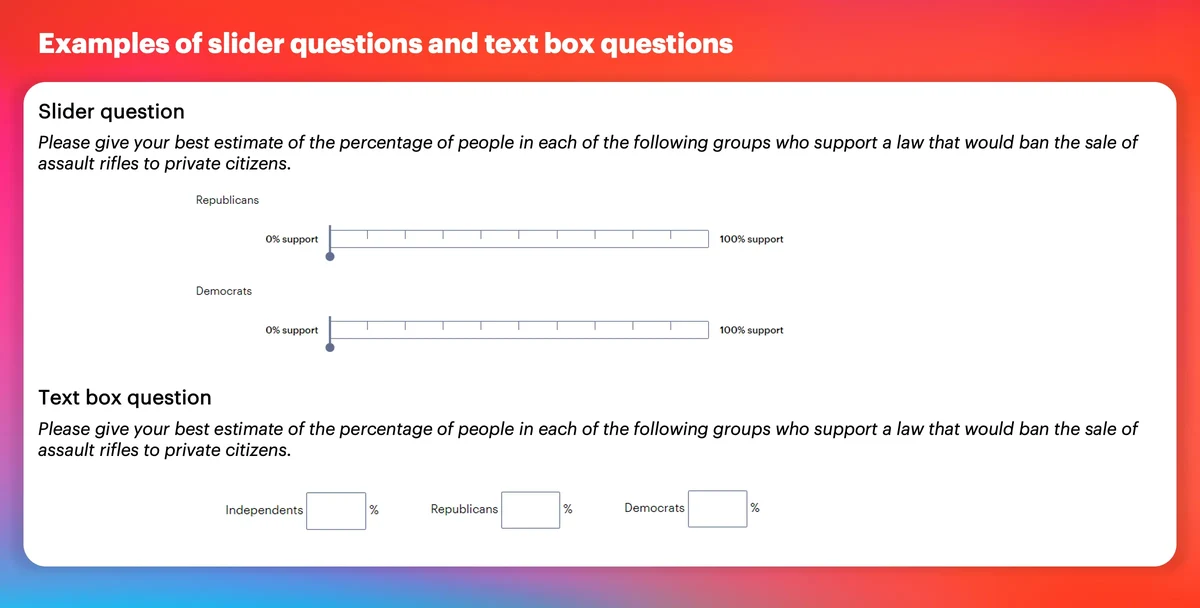
Online surveys often ask people for numeric ratings (e.g. feeling thermometers) or numeric estimates. There are multiple ways to ask these types of questions. One common way is to use a slider scale, which presents the individual with a numeric scale that is anchored on both ends, and asks them to move a widget to the number of their choosing. Another alternative is to present individuals with a textbox and ask them to type in a valid number within a certain range.
Each method may have advantages and disadvantages, and tradeoffs may arise particularly when thinking about the primary type of device that will be used by respondents. For example, slider scales may be more interactive and attention-grabbing, but may also be more difficult for those relying on point and click vs. touch screens. Moreover, textbox entry may be a more a labor-intensive form of entry, but it may also be hard to fully visualize larger slider scales on smaller screens.
But perhaps more importantly, there is the issue of whether responses generated by the two formats are equal and/or comparable. Prior work shows that when individuals are presented with textboxes they tend to only consider the low endpoint of the scale about which they are asked. But when presented with a slider scale, individuals will tend toward high endpoint bias where they consider both the low and high endpoints. In addition, textboxes have a greater tendency to induce round number bias, wherein individuals are more likely to select numbers that end in 0 or 5. Do these biases lead to systematically different estimates of aggregate opinion? And is one format more accurate than the other?
Experimental setup
To evaluate the impact of question format on survey responses, we fielded a survey experiment. All respondents were asked the same 15 questions, but random assignment determined whether all fifteen were asked using slider scales or textboxes.
Research hypotheses and questions
Going into this experiment, we had the following hypotheses and research questions (for additional detail, see our preregistered research design):
H1: Due to high endpoint assimilation effects, responses given using slider scales will be closer to the high endpoint than responses given using a textbox.
H2: Though consideration of both endpoints should result in higher answers in general, we hypothesize that this tendency will interact with partisan biases such that the endpoint (low or high) that is most influential will vary. Specifically, partisan biases will interact with endpoint assimilation effects such that responses about in-partisans (out-partisans) will be closer to the endpoint that results in the more favorable (unfavorable) rating of that group.
This means that for feeling thermometer ratings, in-party targets will be given higher ratings when using a slider scale and out-party targets will be given lower ratings when using a slider scale. For policy support, Republicans (Democrats) using slider scales will place both parties closer to the liberal (conservative) endpoint, as doing so reflects the need to see outgroups as homogeneously stereotypical and ingroups as more heterogeneously counter to stereotype.
H3: Due to round number bias, responses given using textboxes will be less diverse than responses given using slider scales.
RQ1: Does one format (slider scales vs. textboxes) lead to more accurate responses than the other?
Data
To test these hypotheses, we asked respondents to use a 0-100 scale to rate the favorability of three explicitly partisan groups (Democrats, Republicans, and Independents) and three groups with varying degrees of stereotypical association with U.S. political parties (union members, big business, and wireless carriers). We also had respondents estimate the percentage (0-100) of Democrats, Republicans, and Independents that supported three different policies:
- A bill banning all abortions after the 20th week of pregnancy
- A bill banning assault rifles
- A bill banning online platforms from giving preference to their own products at the expense of competing products from other businesses
Evaluating the hypotheses and research questions
H1: The expectation is that when individuals use textboxes, they calibrate their responses to the starting point of the scale. But when individuals use slider scales, they consider distance from both the starting and ending point and become more likely to use higher points on the scale. Thus, we will look at the means of the responses given to each individual question as well as an index that is the mean of an individual’s responses to all fifteen questions. We expect the slider scale group to give higher responses.
H2: Given the partisan nature of many of these groups and issues, we expect that whether it is the low endpoint or the high endpoint that is favored by partisan respondents in the slider scale group will depend on partisan stereotypes. We evaluate this by interacting responses with partisanship variables. Democrats in the slider scale group should give lower ratings to Republicans and big business, but higher ratings to Democrats and union members. This pattern should reverse for Republicans. And on the issue estimates, Democrats should assume more Republicans and Democrats support banning abortion after 20 weeks, while fewer Democrats and Republicans support banning assault rifles. Again, the reverse should hold for Republicans. Independents, wireless carriers, and the internet bill are not analyzed here, as they are included as less partisan baselines for use in more exploratory analyses.
H3: Response variation is the number (0-15) of unique responses given across the 15 questions. We expect this number to be smaller in the textbox group.
RQ1: We can compare the bill support estimates to actual group support from the 2022 Cooperative Election Study (CES) to test for accuracy. The magnitude of accuracy is calculated as the absolute value of the estimate from the actual percentage. To test whether accuracy varies with partisan bias, we interact partisanship with measures that account for whether the respondent over- or underestimated the percentage.[1]
Method
To test our expectations, we use difference of means tests and regression analyses.
Results
In all but one case, the differences between the two formats were as expected and statistically significant at the 95% level. Respondents in the slider scale group gave substantially higher responses than those in the textbox group.
There is very little evidence of partisan bias. In general, estimates of higher responses are correct, while estimates of lower responses are not. This instead suggests that there is simply high endpoint bias operating, regardless of partisanship.
Hypothesis 3:
Due to round number bias, responses given using textboxes will be less diverse than responses given using slider scales.
The results are statistically significant and consistent with our expectations. Those in the slider scale group gave an average of 11.09 distinct responses, while those in the textbox group gave an average of 7.96 distinct responses. This difference is significant at p<.001.
RQ1: Does one format (slider scales vs. textboxes) lead to more accurate responses than the other?
In six of the nine cases, the textboxes result in significantly more inaccurate responses. Given that the textboxes also result in significantly lower responses, this suggests that the high endpoint biases observed do not necessarily compromise the quality of the data.
Is inaccuracy due to partisan bias? To test this possibility, we perform analyses that were not preregistered. In each case, we code whether the respondent overestimated, underestimated, or correctly estimated the percentage of individuals in that category. We then interact this with partisanship to see if there are systematic differences related to party.
There are very few significant differences in the direction of inaccuracy and no real evidence of partisan bias. Overall, it seems that textboxes are just generally more inaccurate.
Attentiveness
We did not preregister any expectations about attentiveness, but explore that here, as this can be a potential indicator of data quality. As a check on attention, we embedded a question on the abortion grid of both experimental groups that instructed individuals in the textbox condition to leave that item blank and individuals in the slider scale condition to leave the slider at the starting point. The percentage of individuals in the slider scale group who passed (60) was significantly lower than the percentage passing in the textbox group (90). However, there was an abnormally large number of zeroes in the slider scale group, suggesting some kind of issue with those in the slider scale such as not being able to deactivate the slider once clicked upon or not fully understanding the instructions. If we count anyone selecting 0 in the slider scale group as passing the attention check, this narrows the gap (78% passing vs. 90% passing), but is still a statistically significant difference. This is not, however, a difference that can be due to those in the slider scale group rushing through, as the differences in time spent are not significantly different (44.10 seconds per grid in the slider scale group vs. 39.23 seconds per grid in the textbox group). So in sum, more work is needed to assess this potential inattentiveness with slider grids and it weighs against the increased inaccuracy of textboxes.
General discussion
The results of this experiment show that when compared to textboxes, slider scales bias answers toward the high endpoint but also increase the accuracy of responses to questions with an objective correct answer. This difference in accuracy may be due to the fact that individuals use fewer distinct response options when in the textbox group. There is little to no evidence that partisanship biases responses in one direction of the other. Indeed, the upward bias evident in the slider scale group is present even when the targets of evaluation are neutral (e.g. independents). Though we cannot assess the objectively “correct” level of sentiment toward parties and groups, the fact that slider scales are more accurate and textboxes are prone to round number bias suggest that slider scales may also be giving more accurate pictures of subjective evaluations. Studies where the same individuals use both formats may be particularly informative. But even without judgements as to which format is “better,” these results importantly show that care should be taken when comparing results obtained from different question formats, as slider scales lead to systematically higher responses. For example, this finding can lead to questions about the degree to which changes or overtime trends should be taken as products of measurement or true shifts in opinion.
About the author
Elizabeth Simas is an associate professor in the Political Science department at Texas A&M University. Her research uses survey and experimental data to explore the behavior of both candidates and voters in U.S. elections. More specifically, her work looks at the causes and consequences of candidate position-taking, individual issue preferences and their effects, and how non-policy factors influence voters’ decisions and behaviors.
About Methodology matters
Methodology matters is a series of research experiments focused on survey experience and survey measurement. The series aims to contribute to the academic and professional understanding of the online survey experience and promote best practices among researchers. Academic researchers are invited to submit their own research design and hypotheses.