
Exploring alternatives to Likert scale survey questions
Chris Hauck - September 18th, 2024
Does survey takers' comfort with Likert scales lead to lower accuracy data? This methodology experiment - part of our ongoing Methodology matters series - pits a ranking-based question design with the traditional Likert scale.
Introduction and background
Likert-type questions are very common in survey research and they offer a variety of advantages. One of the primary advantages lies in their familiarity for respondents who have likely encountered similar items in the past. The survey research field is also very accustomed to these kinds of questions.
However, it is possible that this comfort with Likert scales leads to undesirable respondent behavior such as speeding through the survey or not paying much attention to the questions. The insights industry has leaned heavily on the Likert scale in most survey methodologies for almost 100 years, which has caused respondents to become inured to the approach. Survey designs that used to work relatively well in the past no longer work because the scale has become relatively flat and does a poor job of differentiating between brands, attributes or answers in a question set.
The basis of this experimental design study is the theory that due to 100 years of asking questions in the Likert format and the oversaturation of customer satisfaction research, Net Promoter Score (NPS) programs, and more, respondents have become accustomed to using a scale point at the top of the scale to represent their relatively positive outlook on life while also not taking the time to read or consider the question being asked.
We are also motivated by the need to redesign survey questions so that we could produce more meaningful results as Likert scale questions became less differentiated. There are two important considerations. First, people do not naturally consider their feelings or attitudes on a numeric scale. Second, people more readily weigh attributes, items, decisions, or companies in a relative context. Non-relative decisions are out of context and, therefore, difficult to measure accurately or meaningfully. Even impulse purchases are subject to an invisible competitive context. Survey researchers can and should be exploring alternative question types beyond Likert scales that can be placed in a relative context for a more accurate measurement.
>View data collection methodology statement
Experimental design
The goal of this experiment was to compare the Likert scale-based approach to understanding the relative value of a set of attributes (Control Cell) to an alternative approach in which all attributes are presented together in a competitive context where respondents first rank a set of attributes and then allocate a fixed number of points across each attribute (Test Cell).
Two unique questions are asked, one that mimics the traditional Net Promoter Score approach and one similar to evaluating a series of attitudinal attributes. Both sets of questions are very common uses of Likert Scale questions in today’s marketing research environment.
| Control Cell | Test Cell | |
|---|---|---|
US nationally representative sample of adults | 589 | 581 |
Average survey length in minutes | 6.9 | 9.3 |
Average Survey Satisfaction score | 2.5 | 1.5 |
(Survey Satisfaction score is the mean response to the following question: "One last thing before you go. How was this survey experience? 1. Excellent, 2. Good, 3. Fair, 4. Poor")
This project was designed as an experiment in which each recruited respondent is equally likely to be in either the control or the test cell. Random assignment to the treatment or control group ensures that differences between the cells can be attributed to the experimental manipulation rather than other factors.
Research hypotheses
Hypothesis 1: Likert scale data measuring attributes will produce relatively flat and undifferentiated data compared to an alternative, two-stage approach using ranking and scoring.
Hypothesis 2: We anticipate the respondents in the test cell will report a significantly better survey experience compared to those in the control condition.
Evaluating the hypotheses
We tested our hypothesis on two levels, first in terms of the aggregate data result, comparing the relative difference between the attributes. Our second level of evaluation was to use ANOVA at the individual level, comparing the set of attributes.
In addition, we also considered the methodology's impact on respondent attitudes towards the experience and on mean survey length.
Results
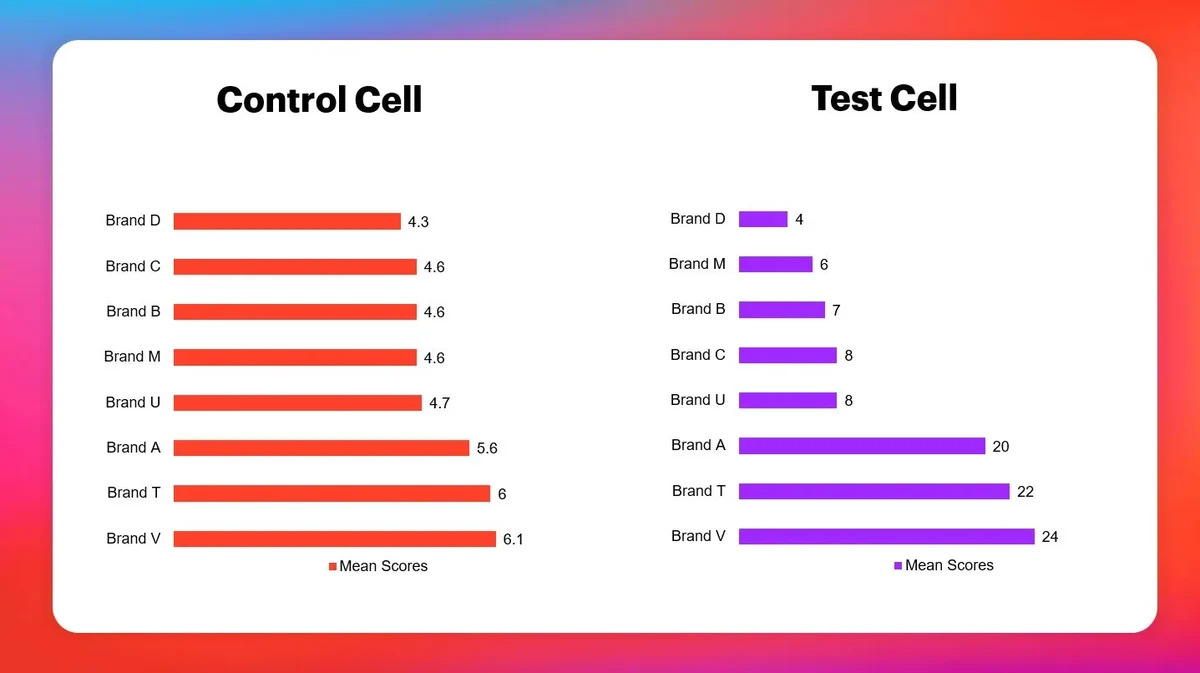
Question set 1: Net Promoter Score using Likert scale (control) vs. a ranking and scoring technique (test).
Traditionally, the NPS question is only asked of the brand of interest. In order to provide a comparative format, we asked the same NPS question of key brands in the mobile telephone service industry: how likely are you to recommend each of these brands to a friend or colleague?
Question Sequence
Control Cell
On a scale from 1-10, where 1 means not at all likely and 10 means very likely, how likely are you to recommend each of these brands to a friend or colleague? [PRESENT EACH BRAND ONE AT A TIME]
Test Cell
Q1. Please sort these brands from most likely to recommend to a friend or coworker to the least.
Q2. Please allocate 100 points across all these to show how likely you are to recommend each brand. If your top brand is the only one you recommend, give it 100 and the rest a 0. If you are equally likely to recommend, share the points. Just remember that you can’t allocate more points to a lower-ranked item to you.
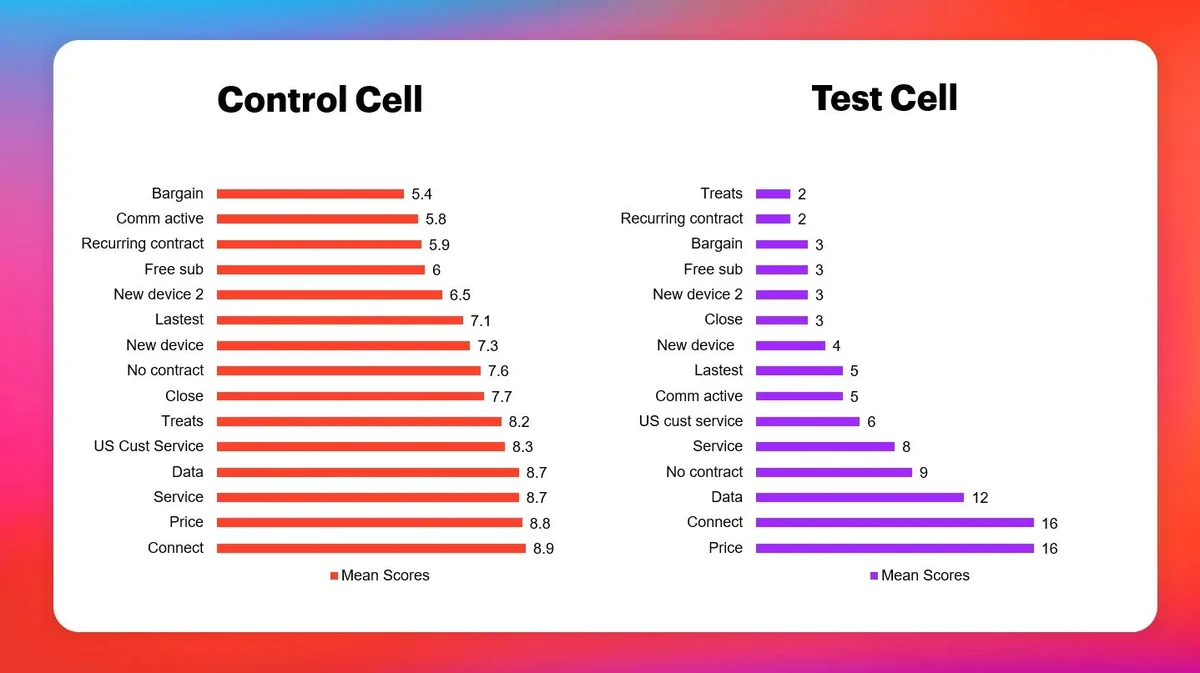
Question set 2: We have similar differentiated results when questions are about attribute values. In keeping with our telecom example where rating a set of descriptive experience attributes is relatively common, we ask: How important is each factor to you in your decision to choose a mobile service provider?
Question Sequence
Control Cell
On a scale from 1-10, where 1 means not at all important and 10 means very important, how important is each factor to you in your decision to choose a mobile service provider? [PRESENT EACH ATTRIBUTE ONE AT A TIME]
Test Cell
Q1. Please carefully review this list of reasons for choosing one mobile service device brand over another. Once you have reviewed the list, please sort this list from the most important reason for you to the reason least important to you.
Q2. With this list sorted in order of most important to 5th most important to you, please allocate 100 points across these five to show how important each is to you. If your top item is the only one that is important to you, give it 100 and the rest a 0. If they are equally important to you, share the points. Just remember that you can’t allocate more points to a lower-ranked item to you.
| Label | Attribute |
|---|---|
Connect | Has good service connectivity where I live and work |
Data | Has data plans that meet my usage needs |
Price | Is reasonably priced |
Service | Has excellent customer service |
New device | Offers a new device at a reasonable price when I sign my contract |
New device 2 | I can get a new device every two years |
No contract | No contract – I can go month to month |
Recurring contract | Offers recurring one-year contracts |
US customer service | Customer service based in the US |
Bargain | Offers bargain price tickets to activities like concerts and sporting events |
Free sub | Offers a free subscription to a movie service subscription like Netflix |
Comm active | Is socially active in my community doing good works |
Close | Has a retail location close to me |
Latest dev | Has the latest devices for me to choose from |
Treats | Treats me as an important customer to them |
Survey Experience
Measure of differentiation in attribute ratings via ANOVA
The ranking and scoring design clearly produces more differentiated, interesting and usable results in our example set of questions, that does not hold up at the individual level. When using ANOVA to test this differentiation across attributes, results show the ANOVA to suggest that there is considerably more differentiation across attributes with a Likert scale as opposed to the ranking and scoring approach.
Once you understand the basis of the ANOVA test, you’ll quickly understand why. ANOVA looks at the data at the individual level, and because the ranking and scoring design only produces scores for the top items in the top five ranks and gives the others a score of zero by design, and this design decision produces less variability overall due to the large number of zeros in the set of ratings.
Survey Length
Survey length is also a bit longer in the ranking and scoring design cell than in the Likert scale cell. And this is not particularly surprising, as the respondent is asked to do more work in the test cell and give the exercise more attention than in the control cell. In our test, basically, two questions in the control cell and four in the test cell, the total average survey length was 6.9 minutes for the control cell and 9.3 minutes in the test cell. The additional time can only be attributed to the greater effort required to complete the test cell version of the survey.
Respondent satisfaction with the experience
We employed YouGov’s standard survey satisfaction question to evaluate respondent satisfaction with the survey experience. This question is asked on a 4 point scale as follows: "One last thing before you go. How was this survey experience? 1. Excellent, 2. Good, 3. Fair, 4. Poor."
Mean score for the control cell was 2.5, between Good and Fair while the test cell was a 1.5, between Excellent and Good. The ranking and scoring method provided a significantly better experience for the respondent.
In conclusion
This experimental design of two different approaches to understanding consumer preferences provides evidence that a traditional approach using Likert scales is less effective in terms of differentiation across the attribute measures than the ranking and scoring design.
This alternative approach is not without its costs. The ranking and scoring method for the same content used about 2.5 minutes of additional respondent time. However, respondents in this longer version of the survey reported a significantly better experience.
About the author
Chris Hauck is a market researcher with more than 35 years of experience in the field. He has honed his research skills across a wide variety of categories - from telecom and IT to consumer packaged goods, hospitality, medical products, and consulting. Undoubtedly influenced by a colorful, exotic upbringing in West Africa, Chris has an almost insatiable desire to explore and stretch his professional range. Chris opened HauckEye LLC on January 1, 2020, dedicated to experiential marketing research. He also started SCORE Metrics, using his Sort and Score technique to improve on tracker programs based on Likert scale questions. He’s been on the client side with GTE (now Verizon) and the supplier side with various large and small providers, including a firm he started in 2000. Chris has a BBA and MBA from Texas Christian University in Ft. Worth, TX, and lives in Longmont, Colorado.
About Methodology matters
Methodology matters is a series of research experiments focused on survey experience and survey measurement. The series aims to contribute to the academic and professional understanding of the online survey experience and promote best practices among researchers. Academic researchers are invited to submit their own research design and hypotheses.