Urban Indians look forward to Diwali but are cautious about non-essential spending
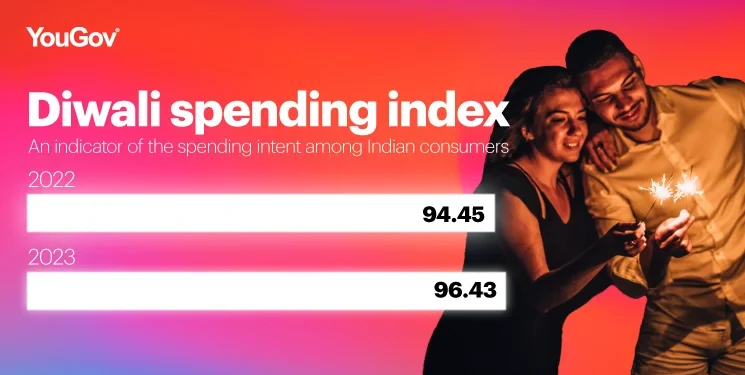
As brands prepare for the upcoming festive season, YouGov’s Diwali Spending Index reveals a spending propensity of 96.43 among urban Indians.
Since 2020, YouGov’s Diwali Spending Index has been tracking the spending propensity of consumers during the Diwali season. This year’s data reveals a slight increase in the spending propensity from last year (94.45 in 2022), highlighting a somewhat similar enthusiasm among consumers.

The Index was calculated as a weighted impact of 9 factors (like increase in gross household income, increase/decrease in household expenses, intent to invest or splurge, and general optimism towards the economy) on their intent to spend more/less this Diwali season versus last.
Among the 9 factors, the attribute which seems to have the highest weightage on the score is the increased household income. Almost a third of urban Indians (32%) agreed with the statement, “My gross household income is higher today than it was a year ago” – an increase from 22% who said this last year.
Furthermore, nearly three in ten (27%) agreed that they have more savings today than a year ago. Having said that, the number of people who claim their household expenses have gone down since last year has decreased from 20% in 2022 to 15% in 2023.
Although urban Indians appear to be in a better monetary position, the rising cost of living could have had an impact on their spending behaviour. The data shows that three in ten urban Indians (31%) said they are likely to spend more than last year during Diwali in 2023, down from 36% who said this in 2022. In contrast to this, a higher number of people said they will spend less during Diwali this year than those who said this last year (26% in 2023 vs 21% in 2022).
When probed further, a majority of urban Indians (52%) claim they have been finding it difficult to meet their monthly expenses in the last three months. Increase in the cost of living due to inflation was stated as the biggest reason for this (as said by 39%), followed by increase in cost of living due to other reasons (30%).
This has affected spending behaviour, with people postponing or cancelling big spends in the next few months (32%) or taking steps to reduce or cut spends on non-essential items (31%). Some have used savings (17%), while others have borrowed money or taken loans to manage the situation.
As the data shows, although there has been an improvement in net perceptions on income and savings versus last year, with urban Indians trying to battle the rising cost of living, they may be forced to cut down their spending on non-essential items during the upcoming festive season, leading to some adverse impact on retailers and brands.
Commenting on this, Deepa Bhatia, General Manager at YouGov India, said, “As the data shows, the rising cost of living is likely to have an unfavourable effect on discretionary spending this festive season. With consumers being cautious, brands and marketers will have to emphasize on affordability through offers and value for money propositions. An understanding of consumer sentiment will enable them to communicate better and manage the expectations of their target audience.”
Methodology:
The Diwali Spending Index is based on data collected through a survey conducted on a sample of 2010 respondents on YouGov India’s online panel in July 2023. The sample primarily constitutes consumers from NCCS A (with some proportion of B); and matches the population numbers of urban India in terms of basic demographics like age, gender, regions, and city tiers.
The Index is calculated as a weighted impact of 9 factors (like increase in gross household income, increase/decrease in household expenses, intent to invest or splurge, and general optimism towards the economy) on their intent to spend more/less this Diwali season versus last. While the Index in the previous years was based on 10 factors, one of the factors was directly related to the impact of Covid on consumer sentiment, which was excluded from the equation this year.
The Index has been derived using Ordinal Logistic Regression and Johnson’s Relative Weight modeling to understand the relationship between each of the factors and the overall intention to spend more this Diwali amongst consumers.
For the calculation of the final Index, two sets of weighted averages were calculated basis respondent data – 1) assuming an equal weightage for all factors (which has been used as the base); 2) with actual weights for each of the factors derived from the regression and JRW analysis.
The final Index = Actual weighted spending intent / Hypothetical spending intent assuming equal weightage to all 9 predictors