US: How has the Grimace Shake TikTok challenge impacted McDonald's?
Last month, McDonald’s released a special meal and a purple, berry-flavored shake to celebrate the birthday of its purple monster mascot, Grimace. Soon after, a TikTok creator posted a video where he tried the shake and faked his own death. The video has since inspired thousands of other TikTok users to post similar videos or ‘Grimace Shake Incidents’ on the platform.
With McDonald’s riding on this Grimace-fueled TikTok wave, we look at YouGov data to see what the fast-food chain’s Purchase Intent score looks like among Americans who use TikTok for at least an hour a week (i.e. TikTok users).
According to YouGov BrandIndex, which tracks consumer sentiment towards thousands of brands daily, McDonald’s’ Purchase Intent, which measures which brands consumers are most likely to purchase from among TikTok users grew significantly in June 2023, from 25% on June 1, 2023, to 32% on June 28, 2023.
By comparison, McDonald’s Purchase Intent among the general US population remained mostly unchanged through the observation period.
McDonald’s Satisfaction score among TikTok users followed a trajectory similar to the brand’s Purchase Intent movement - suggesting that this audience may have in fact actually liked the Grimace shake, beyond just hopping on to the TikTok trend.
The brand’s Satisfaction score, which measures whether customers are satisfied or dissatisfied with the brand, increased from a net score of 41 on June 1, 2023, to 52 on June 28, 2023.
Explore our living data - for free
Discover more FMCG content here
Want to run your own research? Run a survey now
Make smarter business decisions with better intelligence. Understand exactly what your audience is thinking by leveraging our panel of 20 million+ members. Speak with us today.
Methodology: YouGov BrandIndex collects data on thousands of brands every day. McDonald’s Purchase Intent score is based on the question: From which of these would you be most likely to purchase? and delivered as a percentage. Its Satisfaction score is based on the question: Of which of the following restaurants would you say that you are a satisfied customer/dissatisfied customer? And delivered as a net score between -100 and +100. Scores are based on an average daily sample size of 141/3364 US adults between June 1, 2023 and June 28, 2023. Figures are based on a four-week moving average. Learn more about BrandIndex.
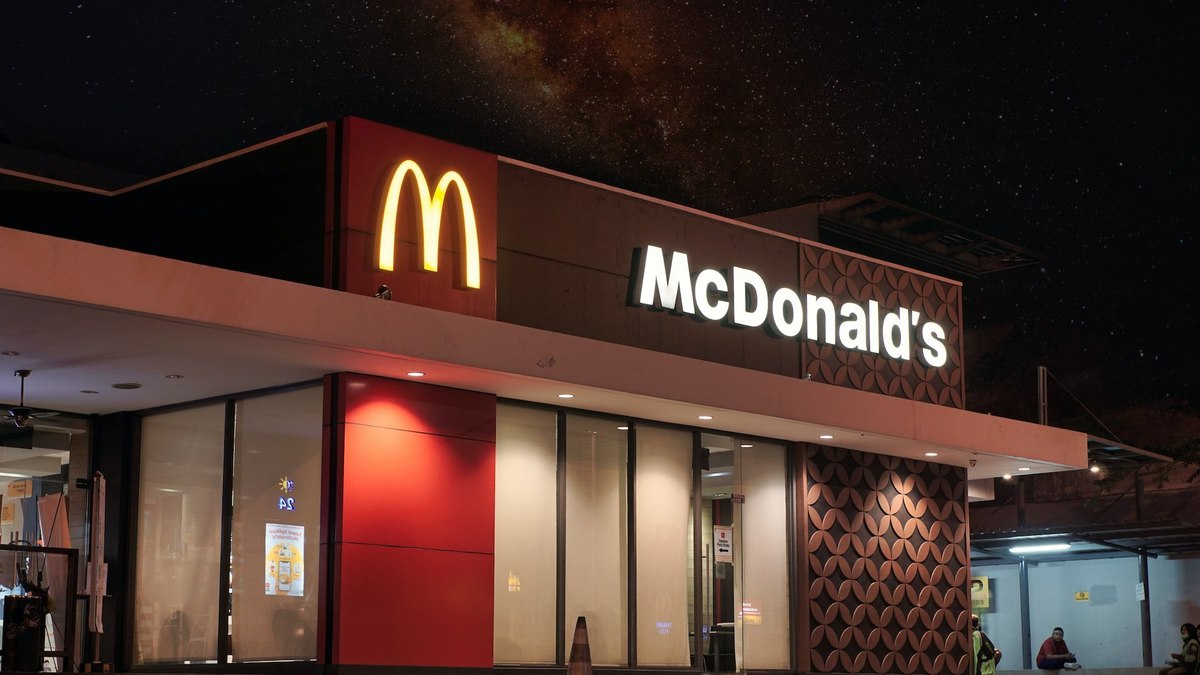
Photo by Visual Karsa on Unsplash