US: e.l.f. Cosmetics records spur in Q4 2022 sales - What has the quarter been like for the brand?
American affordable cosmetics brand, e.l.f Cosmetics, has reported a 49% increase in net sales year-on-year for Q4 2022. The brand has lifted its outlook for the fiscal year, with net sales expecting to touch $541-545 million up from previous estimates of $478-486 million.
e.l.f Cosmetics credits the “quality of (its) products at the prices” they’re being offered at, its “marketing and digital initiatives” and “viral buzz” as some of the reasons behind attracting new audiences and its Q4 2022 performance.
How has the previous quarter been for the brand?
According to YouGov BrandIndex - which tracks consumer sentiment towards thousands of brands daily - e.l.f Cosmetics’ Value scores improved in Q4 2022. The Value score - which measures whether the brand represents poor or good value for customers’ money - grew three points from a net score of 11 on October 1, 2022 to 14 on December 31, 2022, peaking at a net score of 15 on November 20, 2022.
Similarly, the beauty retailer’s Buzz metric - which measures whether consumers are hearing more positive or negative things about the brand - improved three points too, growing from a net score of 4 on October 1, 2022 to 7 on December 31, 2022.
Explore our living data - for free
Discover more retail content here
Want to run your own research? Run a survey now
Make smarter business decisions with better intelligence. Understand exactly what your audience is thinking by leveraging our panel of 20 million+ members. Speak with us today.
Methodology: YouGov BrandIndex collects data on thousands of brands every day. e.l.f Cosmetics’ Value score is based on the question: Which of the following beauty care brands do you think represents good value/poor value for money? and delivered as a net score between -100 and +100. Its Buzz score is based on the question: Over the past two weeks, which of the following beauty care brands have you heard something positive about/negative about? and delivered as a net score between -100 and +100. Scores are based on an average daily sample size of 2104 US adults between July 1, 2022 and February 5, 2023. Figures are based on a four-week moving average. Learn more about BrandIndex.
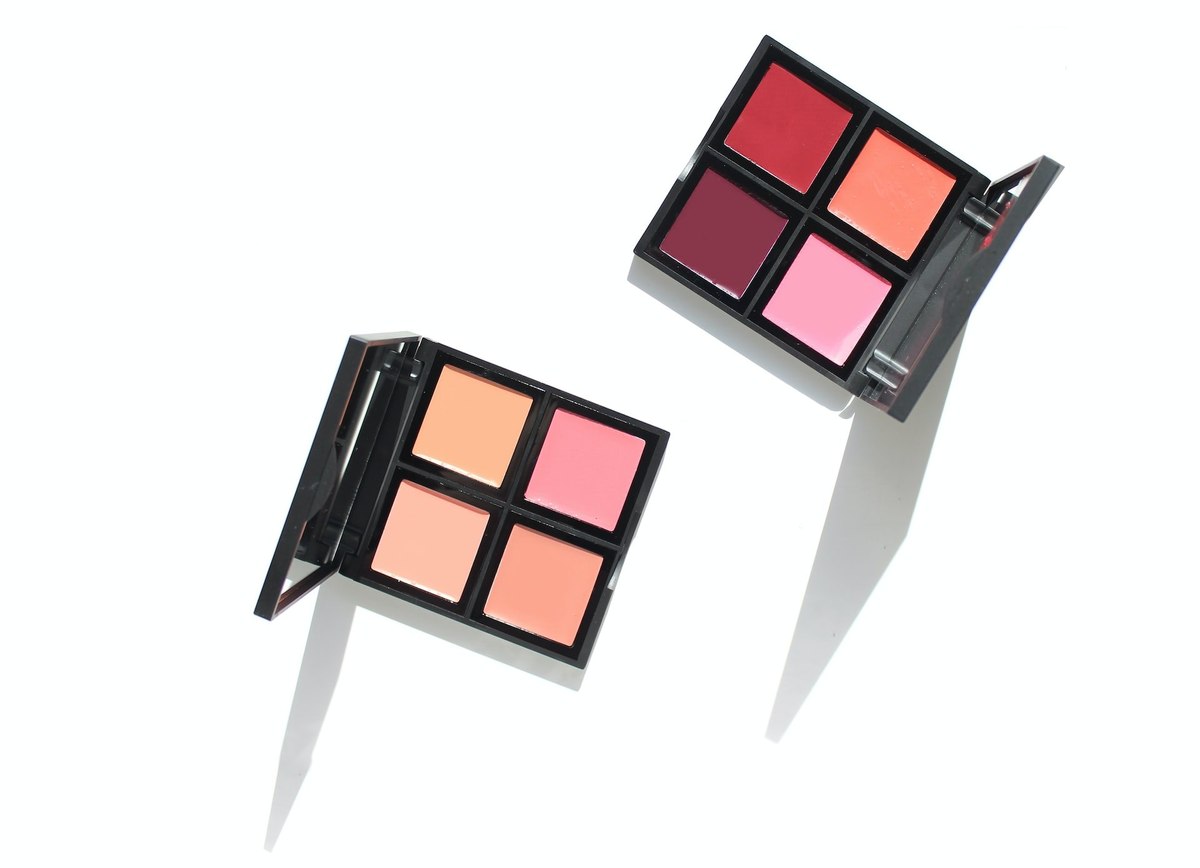
Photo by Evangeline Sarney on Unsplash