US – Inside the mindset of March Madness fans: Who they are, how they gamble and more
YouGov - March 30th, 2023
As the 2023 edition of the March Madness comes to a close, we dip into syndicated YouGov data to identify and better understand the consumers who watch or follow the NCAA’s flagship basketball tournament.
Current Customer scores from events data housed within YouGov SportsIndex reveals that a tenth of all Americans have watched or attended March Madness in the past 12 months and we’ll refer to this group as March Madness fans.
March Madness fans: The key demographics
The event is particularly popular among older Americans – a third of these fans are aged over 65 (32%) and two-fifths are aged between 45 and 64 (38%).
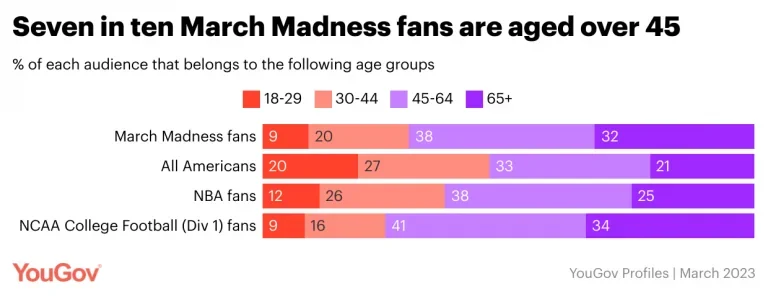
To contextualize this data, let’s compare the age break up to the overall American population as well as to fans of the NBA and of College Football. The comparative data reveals that even though those aged 18-29 are under-represented among fans of March Madness when compared to the national population (9% vs 20%), they make up an identical share of College Football fans (9%) and only a slightly higher portion of NBA fans (12%).
A third of March Madness fans are women (32%), which is higher than the share of women among College Football fans (29%), but lower than the share of women among NBA fans (39%).
Perhaps because of its slightly older demographic, March Madness fans are also a more affluent lot. Nearly a seventh of them belong to the higher-income group (14%), compared to just 8% of all Americans, a tenth of all NBA fans (10%), and 12% of college football fans.
Attitudes and behaviors of March Madness fans
Demographics are one part of the story, but YouGov Profiles can go deeper to identify attitudes, consumption behaviors and tendencies towards hundreds of diverse psychographic variables.
Our data shows that March Madness fans are much likelier than the overall American population to actively watch, read or listen to the news at least once a day (87% vs 72%). They also enjoy discussing current events with their social circles (73% vs 64%).
They are also more receptive to TV advertising with three-fifths of them saying they would advertise to themselves on that medium (58% vs 43%). They are also seven percentage-points likelier to pick radio as a channel of advertising (26% vs 19%).
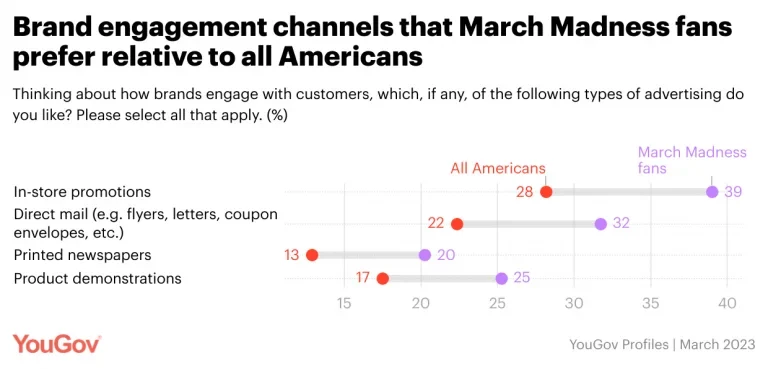
When it comes to brand engagement, March Madness fans show a strong relative preference for in-store promotions (39% vs 28%), direct mail (32% vs 22%), printed newspaper (20% vs 13%) and product demos (25% vs 17%).
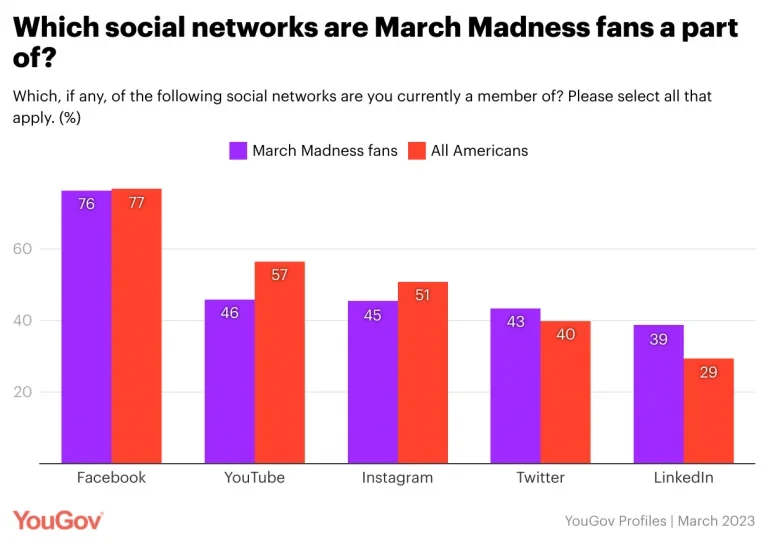
They are less inclined than the general population to use the more casual social media platforms such as Instagram (45% vs 53%) and YouTube (46% vs 57%), but are more likely to be members of LinkedIn (39% vs 29%).
This segment is also financially more secure, with three-fifths of them saying so compared to half of all Americans (59% vs 49%) and are confident when it comes to following a budget (74% vs 67%). Even so they are less likely to stick to a budget when they go shopping (43% vs 51%).
When it comes to advertising, three fifths of them say brands need to find innovative ways to market themselves (75% vs 70%). A roughly equal share of them say they feel bombarded by advertisements (73% vs 70%).
How do they gamble?
A tenth of March Madness fans say they have placed a sports bet online in the last 12 months (11% vs 5% of all Americans) and an equal share of them say they have participated in fantasy sports (10% vs 5% of all Americans).
Overall, about a tenth of them say they place sports bets online at least once a week (9%). A smaller share of them have also placed sports bets offline (7%).
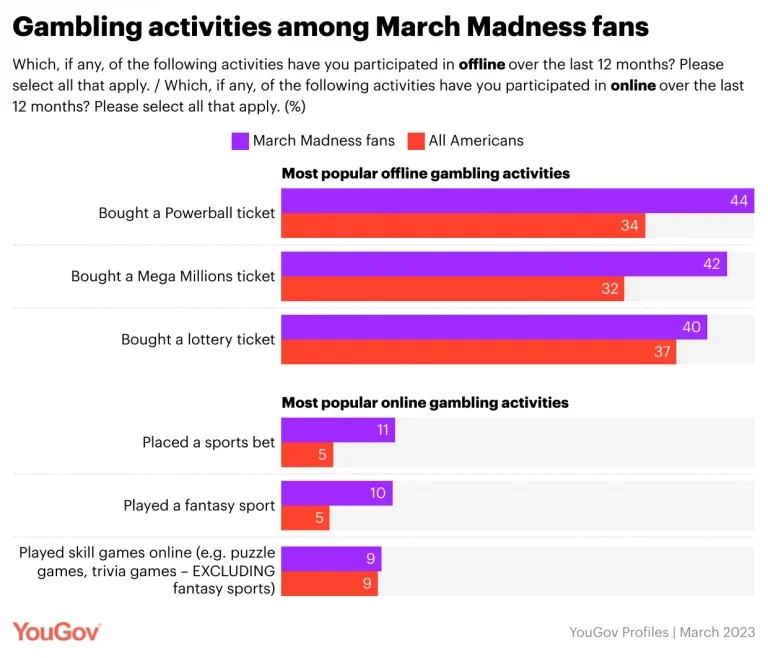
While their likelihood to bet more actively on sports than the overall American population comes as no surprise, our data shows that they are more active participants in other forms of betting too. Looking at offline activities, more than two-fifths have had a flutter on the Powerball (44%) in the last 12 months compared to just a third of all Americans (34%). They are also ten percentage points likelier to have played the Mega Millions (42% vs 32%). Two-fifths of them also participated in the lottery (40% vs 37%).
Explore our living data – for free
Want to run your own research? Run a survey now
Make smarter business decisions with better intelligence. Understand exactly what your audience is thinking by leveraging our panel of 20 million+ members. Speak with us today.
Methodology: YouGov Profiles is based on continuously collected data and rolling surveys, rather than from a single limited questionnaire. Profiles data is nationally representative and weighted by age, gender, education, region, and race.