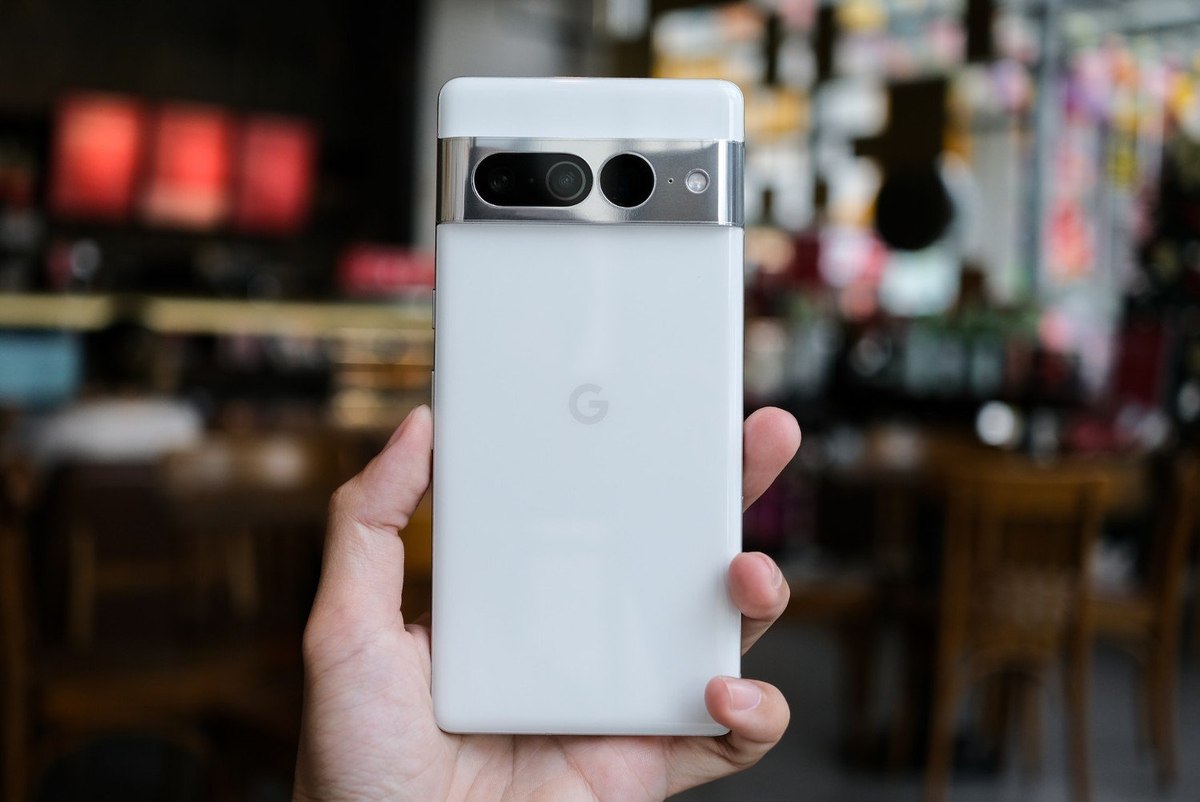
The steady rise of Google Pixel in the UK
Reports say that Google has increased its marketing spend on the Pixel line in the UK since 2021 and the results are showing.
Data from YouGov BrandIndex, which tracks hundreds of brands across various sectors, shows that Google’s phone brand has gained remarkable traction in not only Ad Awareness but in also Impression and Consideration since 2021.
Looking at data for each half of a calendar year starting from 2021, Ad Awareness has risen steadily from 2.1 in the first half of 2021 to 16.5 in the first half of 2023. Ad Awareness is reflective of the share of people who say they have seen an ad for a certain brand in the past two weeks. This means that the share of UK consumers who remember recently seeing an ad for the Pixel has, on average, risen eight-fold from the first half of 2021 to now.
Needless to say, these scores fluctuate heavily within these broader timeframes. For instance, in the (ongoing) first half of 2023, Ad Awareness for Pixel peaked at 21.4 on March 22 amid a campaign celebrating 50 years of hip-hop. It was even our Advertiser of the Month.
But marketing efforts can be futile unless they resonate with consumers, and our metrics suggest that Google Pixel hasn’t lagged in this regard. Quality scores for the brand have risen from 9.5 to 15.2. Quality score is calculated by subtracting the share of consumers who think a brand represents poor quality from the share of those who think it represents good quality.
All of this translated in Google being able to whip up a desire for the Pixel brand among the UK public, as demonstrated by the rising Consideration scores – the share of those saying they would consider purchasing a Google Pixel product when they are next in the market has risen from 7.8 to 12. In relative terms, this is a 33% increase over the course of two years. In a mature market such as the smartphone one where brand loyalties run high, this type of growth is even more impressive.
But who exactly makes up this audience that considers purchasing from the Google Pixel brand, and what features do they want most?
YouGov’s consumer behaviour tracking tool – YouGov Profiles – allows for the creation of BrandIndex-based filters to look into the demographics and consumer behaviours of various audience groups.
Relative to UK consumers who consider purchasing other popular phone brands, those who consider Pixels are a more involved and aware group. In a question that asks consumers which features they would rate as important in their next smartphone purchase, those considering Google Pixel over-index on all features. Tellingly, only 2% of them say they “don’t know” which features they’d rate important compared to 10% of those who consider other popular phone brands.
Arranging the results by Z-score – a mechanism which dynamically captures the variances between two groups of consumers – gives an insight into the features that could be the biggest relative drawcards for those considering the Google Pixel brand. Unsurprisingly, camera quality (64% vs 46%) tops the list in this regard given Google’s strong emphasis on the camera quality in their product development and marketing. Specialty camera features like Real Tone and Magic Eraser have been big components of the brands marketing push in recent months.
Factors like processor speed (40% vs 26%), battery life (77% vs 65%), water resistance (30% vs 22%) and operating system (49% vs 40%) are also big differentiators between the audiences considering Google Pixel and those considering other popular smartphone brands.
The Google Pixel-considering audience also has a younger make-up, with over a fifth of them aged between 18-29 compared to just 16% of those considering other major smartphone brands. Over a half of them sit in the 30-50 bracket (54% vs 41%).
Only a quarter of them are aged 51 and above (24%) whereas this group makes up more than two-fifths of the audience considering other popular smartphone brands (43%). Three-fifths of those considering Google Pixel are men (61% and 39% women), whereas the other group is more evenly split between men and women (49% vs 51%).
Explore our living data – for free
Discover more telco content here
Want to run your own research? Run a survey now
Make smarter business decisions with better intelligence. Understand exactly what your audience is thinking by leveraging our panel of 20 million+ members. Speak with us today.
Methodology: YouGov BrandIndex collects data on thousands of brands every day. A brand’s Ad Awareness score is based on the question: “Which of the following consumer brands have you seen an advertisement for in the past two weeks?” Data from surveys of adults aged 18 years and above residing in the UK. Response volumes for each half of a calendar year ranged between 14,914 adults to 16,633 adults. Ad Awareness scores are based on a four-week moving average. The change in scores for each brand is calculated by taking the difference between the highest and lowest scoring days within the period. Learn more about BrandIndex.
Image Credit: Thai Nguyen on Unsplash