
Where are American parents taking their kids for summer vacation?
Clifton Mark - June 12th, 2023
With the end of the school year imminent, summer vacation is on the minds of students and parents alike. YouGov DestinationIndex, which tracks consumer attitudes towards travel destinations, can provide insight into where families are planning to go and why. Data from this tool shows that, even though parents rate Florida higher on most metrics, more of them are planning to visit California.
Purchase Intent, one of the metrics tracked by the tool, measures how likely consumers are to choose a destination, from all those they are considering, the next time they plan a trip. Below are the top destinations chosen by US parents of schoolchildren, as measured in the last three months.
Roughly two in five (40%) parents are most likely to choose one of the domestic destinations on this list for their next trip. Four of the top five destinations with the highest Purchase Intent scores are in the continental United States, with California (13%) and Florida (10%) leading the way. Arizona (7%) and Las Vegas (6%) are the fourth and fifth, and New York is the sole destination in northern USA to make the top ten.
The United Kingdom is the most popular foreign destination, with 7% of Americans saying they’re most likely to choose it for their next trip. Other European destinations such as Italy (5%), Barcelona (4%) and Germany (4%) also attract significant proportions of parents. Hong Kong, at 3%, is the sole destination outside of Europe and the USA to make the list.
Why are these destinations so popular? DestinationIndex tracks several metrics that provide more granular insight into travelers' preferences. The chart below compares the top three destinations (California, Florida and the UK) according to Quality, Impression, Value and Satisfaction.
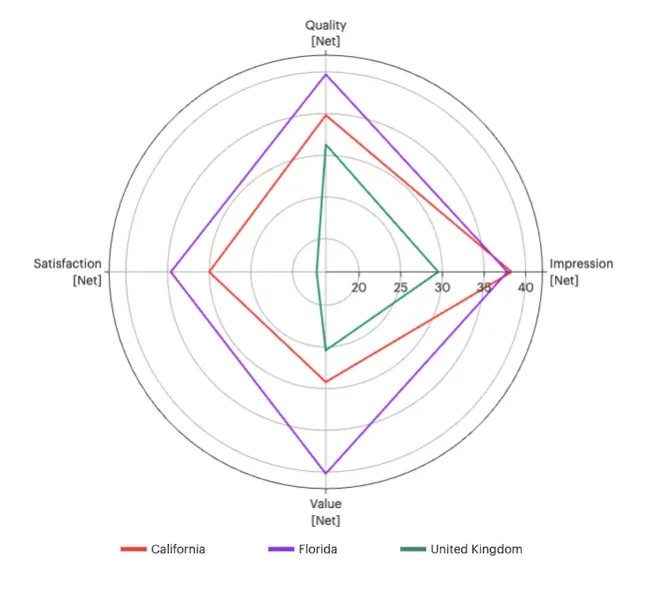
It’s not hard to see why so many Americans say they’ll choose Florida as their next destination, since the state leads in all four of these important metrics. Quality is a measure of consumers who say that the destination represents good rather than poor quality. Of these three destinations, the Sunshine State has the highest Quality score with 40, followed by California at 35. The UK has a score of 31.
Florida also leads in Satisfaction, which is a net measure of how many satisfied visitors a destination has. The state scores 35. California is not too far behind at 30, but the UK lags at 17.
Impression is a measure of whether consumers have positive or negative impressions of a destination. In this case, California is tied with Florida at 38, with the UK at 30.
It’s in value-for-money that the leader truly parts from the pack with a score of 40 compared to runner-up California at 29 and the UK at 25.
These scores raise a question: if Florida is leading in Value, Quality, Satisfaction and Impression, why are more American parents planning to go to California? YouGov Profiles, which contains consumer data on thousands of variables including the reasons that consumers choose their destinations, may provide some insight. The data suggests that those who are choosing California may not be going because they think the state offers the best value, but to see their loved ones.
Over a third (36%) of those planning to visit California say “Having friends/family near my vacation destination” was a reason for choosing their most recent vacation destination. This makes family and friends the most popular reason for choosing a destination among this group. For those who are more likely to choose Florida, value for money is the most commonly-cited reason at 41% with family in third place at 31%.
Get in touch with YouGov to learn more about research and insights solutions for your destination.
Explore our living data – for free
Discover more travel and tourism content here
Want to run your own research? Start building a survey now
YouGov DestinationIndex tracks consumer perceptions toward travel destinations on a daily basis in 30 countries worldwide.
A destination’s Purchase Intent score is based on the question: “Of the destinations considered, which are you most likely to visit? “
A destination’s Quality score is based on the question: “Which of the following destinations do you think represents GOOD/POOR quality?”
A destination’s Value score is based on the question: “Which of the following destinations do you think represents GOOD FOR MONEY? By that we don’t mean ‘cheap,’ but that the destinations offer a visitor a lot in return for the price paid. / Now which of the following destinations do you think represents POOR VALUE FOR MONEY? By that, we don’t mean ‘expensive,’ but that the destinations do not offer a visitor much in return for the price paid.”
A destination’s General Impression score is based on the question: “Overall, of which of the following destinations do you have a generally POSITIVE/NEGATIVE impression?”
A destination’s Customer Satisfaction score is based on the question: “Of which of the following destinations would you say that you are a SATISFIED/ DISSATISFIED visitor?”
All of the above are delivered as net scores between –100 and + 100.
Data referenced in this article from surveys of adults aged 18 years and above residing in the US between 26/02/23 to 25/05/23. Figures are based on a two-week moving average. Learn more about DestinationIndex.