
How Capital One and Discover merger could impact the finance industry
Kineree Shah - February 23rd, 2024
Capital One recently announced a $35.3 billion acquisition of Discover Financial. This merger has the potential to change the competitive landscape, according to data pulled from YouGov’s BrandIndex and Profiles over the past year (February 21, 2023, to February 21, 2024). Here's a brief analysis of what the data suggests about the merger's potential impacts.
Impact of Capital One and Discover merger on current customers
Discover tends to attract a younger crowd, with 12% of its customer base falling within the 18-29 age group, as opposed to Capital One's 7%. This positions Discover as a brand with significant traction among millennials and adult Gen Z, potentially offering Capital One a bridge to these demographics post-merger. On the other hand, Capital One appeals more to the mature segments, with a dominant presence in the 45-64 (41%) and 65+ (32%) age brackets, indicating its products and services resonate well with older consumers.
Financially, Discover customers exhibit a marginally higher affluence, with 11% boasting savings of $100,000, against Capital One's 8%. This suggests Discover's appeal to a financially secure segment, potentially enriching the combined entity's customer mix with a wealthier demographic.
The merger could present a compelling opportunity to unify these demographic strengths. For Capital One, integrating Discover's younger customers could enhance its market penetration among the young generations, injecting fresh perspectives and demands into its product development. Conversely, Discover could benefit from Capital One's stronghold among older demographics, expanding its reach into more stable, financially established markets.
Brand performance overview
- Impression score (whether consumers have a positive or negative impression of a brand): Capital One (25.8) and Discover (23.2) both score higher than the industry average (20.9). Could their powers combined create an even stronger brand?
- Quality score (whether consumers think brand represents good or bad quality): With a net score of 27.8 for Capital One and 24.4 for Discover, both exceed the industry's 20.6 average. Will the combined entity continue to be seen as a provider of superior products and services?
- Value score (whether a consumer considers a brand to represent good or poor value for money): Capital One's net value score of 16.7 and Discover's 14.9 both surpass the industry average of 13.8. Consumers see both brands as offering good value for money, a perception that could be enhanced through the merger.
- Reputation score (whether a consumer would be proud or embarrassed to work for a brand): Capital One (23.5) and Discover (21.3) have reputations well above the industry average (18), indicating that the merger will bring together two brands highly regarded for integrity and reliability.
- Recommendation score (whether consumers would recommend a brand to friends and colleagues): Scores of 20 for Capital One and 17.7 for Discover, against an industry average of 16.7, highlight that customers are more likely to recommend these brands over others.
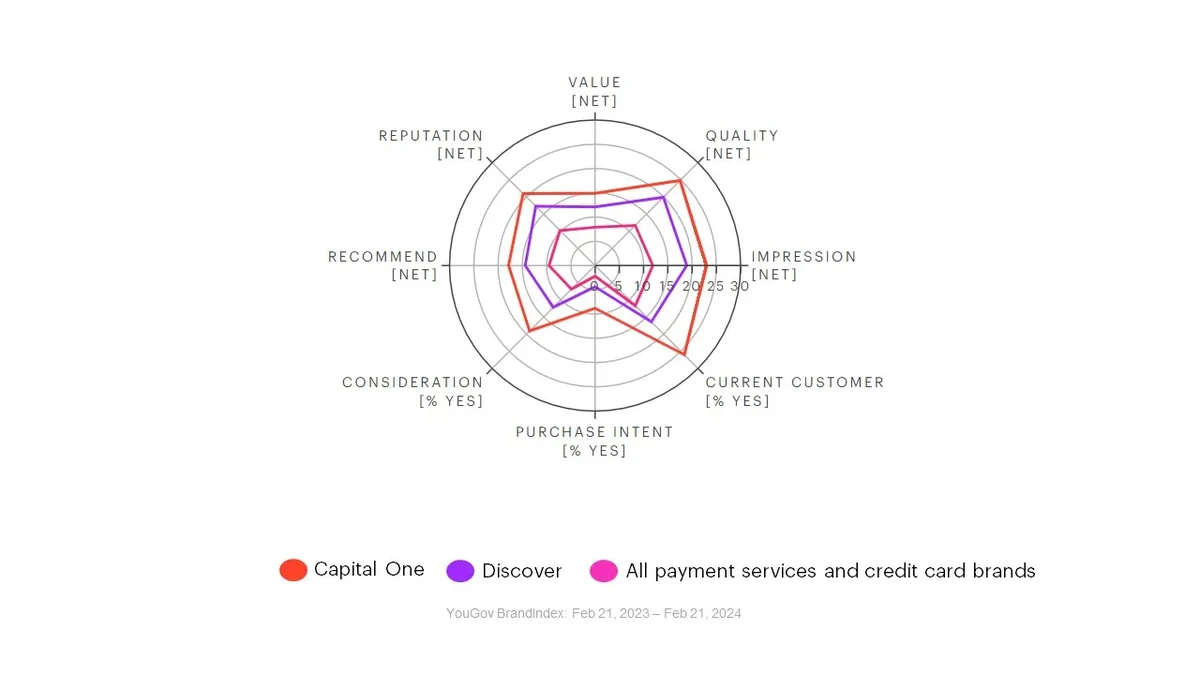
- Consideration score (percentage of consumers considering buying from the brand): With Capital One at 21.4 points and Discover at 15 points, both brands exceed the industry consideration average of 12 points.
- Purchase Intent score (percentage of that are most likely to purchase from a brand): Capital One (9.8%) and Discover (5.4%) have higher purchase intent scores compared to the industry average of 3.9%.
- Current Customer (percentage of consumers who are current customers of a brand): Capital One's Current Customer score of 29.1% and Discover's 20.2% both demonstrate strong customer bases, with Capital One notably higher than the industry average of 20.5%. The merger could help the consolidated company capitalize on and expand this solid foundation of loyal customers.
Make smarter business decisions with better intelligence. Understand exactly what your audience is thinking by leveraging our panel of 20 million+ members.
Methodology: YouGov Profiles is based on continuously collected data and rolling surveys, rather than from a single limited questionnaire. Profiles data for the US is nationally representative and weighted by age, gender, education, region, and race.
YouGov BrandIndex collects data on thousands of brands every day. A brand’s Impression score is based on the question: Which of the following brands do you have a generally POSITIVE/NEGATIVE feeling about? Quality score: Which of the following brands do you think represents GOOD/POOR quality? Value score: Which of the following brands do you think represents GOOD/POOR VALUE FOR MONEY? Reputation score: Imagine you were looking for a job (or advising a friend looking for a job). Which of the following companies would you be PROUD/EMBARRASSED to work for? Recommendation score: Which of the following brands would you RECOMMEND/tell a friend to AVOID? Consideration score: When you are in the market next to make a purchase, which brands would you consider? Purchase Intent score: Of the brands considered, which one are you most likely to purchase? Current Customer score: Which brands have you recently purchased/currently own? Impression, Quality, Value, Reputation, and Recommendations score are delivered as net score between –100 and + 100 while Consideration, Purchase Intent, and Considerations scores are delivered as a percentage. Scores are based on dates between February 21, 2023 and February 21, 2024 among US adults who are aware of the brands.