Disney's century: A look at how the brand’s parks and stores perform in the eyes of consumers
Kineree Shah - October 23rd, 2023
On October 16, 2023, Disney marked its 100th anniversary, a significant achievement for the entertainment behemoth. And the brand’s parks have played a vital role in that longevity, bringing the ‘House of Mouse’ to life for fans since the first opened its doors in 1955.
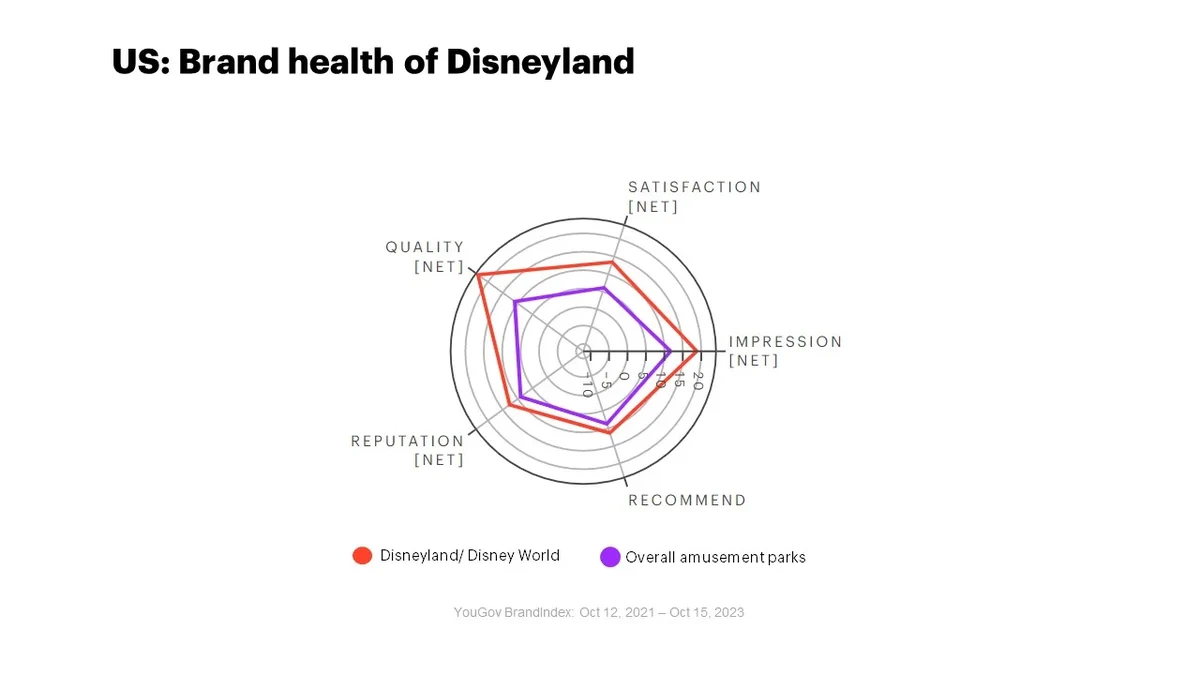
Data from YouGov BrandIndex, spanning from October 15, 2021, to October 15, 2023, showcases Disneyland's standing among Americans across five key metrics: Impression, Satisfaction, Quality, Reputation, and Recommend. Across these, Disneyland consistently surpassed the average scores of all amusement parks YouGov tracks.
Breaking down the metrics:
- Quality (evaluating if consumers perceive a brand as high or low quality): Disneyland garnered a score of 23.3, more than double the sector's average score of 11.
- Impression (whether consumers have a positive or negative impression of a brand): Disneyland achieved a score of 18.8, which is 7.1 points greater than the sector's average of 11.7.
- Reputation (whether a consumer would be proud or embarrassed to work for a brand): Disneyland leads with a score of 12.7, underscoring its distinguished reputation. In comparison, the sector average is 9.0.
- Satisfaction (assessing current consumer contentment with a brand): Disneyland boasts a score of 13.4, while the average for other amusement parks is 6.1.
- Recommend (whether consumers would recommend a brand to others): Disneyland has a score of 11.3, revealing a strong propensity among Americans to recommend the brand to friends and family. This stands against the sector's average score of 8.7.
Additionally, there's been a discernible rise in the Current Customer score, which measures the share of consumers who say they have bought leisure service in the past 12 months. As Disney has bounced back firmly from the depression of scores witnessed during the pandemic, it is noticeable that scores for consumers with a family income of $100k+ have doubled, moving from 4.6 in 2021 to 10.5 in 2023. For a broader perspective, scores for all US adults rose by 1.4 points during the same period.
So, Disney remains an iconic and popular brand – but just how good is it at converting its high levels of awareness into consumers? We looked at purchase funnel conversion for its parks, as well as its stores to find out.
Disneyland
- Awareness: 2023 sees the brand running with awareness of 90.4%.
- Consideration: Of those ,16.1% of Americans would consider visiting a Disney Park, marking a conversion rate of 18%.
- Purchase Intent: 6.3% intend to visit a park, meaning that Disneyland converts a pretty notable 39% of those who are considering a visit.
Transitioning to the retail side, the 2023 metrics of Disney Store are as follows:
- Awareness: Disney Store’s Awareness stood at 78%
- Consideration: Among those aware, 14% of Americans are considering going to a Disney Store.
- Purchase Intent: 2.2% of consumers are most likely to purchase from the Disney Store which converts to a conversion rate of 21%.
As Disney celebrates its 100th anniversary, the metrics underscore its appeal and strong purchase intent among consumers. More recent acquisitions like Lucasfilm and Marvel aim to reinforce this position and prepare the House of Mouse for another 100 years of household fame. At the moment, the brand is looking good for it.
Explore our living data – for free
Discover more leisure and entertainment content here
Want to run your own research? Run a survey now
Make smarter business decisions with better intelligence. Understand exactly what your audience is thinking by leveraging our panel of 20 million+ members. Speak with us today.
YouGov BrandIndex collects data on thousands of brands every day. Scores are based on an average daily sample size of minimum 100 US adults between October 15, 2021 – October 15, 2023. The figures are based on a 02-week moving average. Learn more about BrandIndex.