
National airline Garuda Indonesia heads YouGov’s Travel & Tourism Rankings in Indonesia
Fiona Robinson - February 21st, 2022
YouGov’s latest rankings reveal the airlines, accommodations, leisure attractions and booking marketplaces that made the biggest impressions on Indonesians last year
Flag-carrier Garuda Indonesia has topped YouGov’s Travel & Tourism Rankings in Indonesia with a score of 63.7 – an impressive 37.5 points ahead of the second and third-place rankings, Garuda subsidiary Citilink (26.2) and Aston Hotel (26.2). Garuda had a stellar year, sweeping up several international recognitions at the Skytrax World Airline Awards 2021, including retaining its place on the list of best global airlines. The win also marks the largest gap between first and second place in all nine markets that were covered in the report.
YouGov BrandIndex measures the public’s perception of brands on a daily basis across a range of measures. The brand rankings were compiled using Impression scores across all 52 weeks of last year. Impression scores measure whether a consumer has a positive or negative impression of a brand during the previous two weeks.
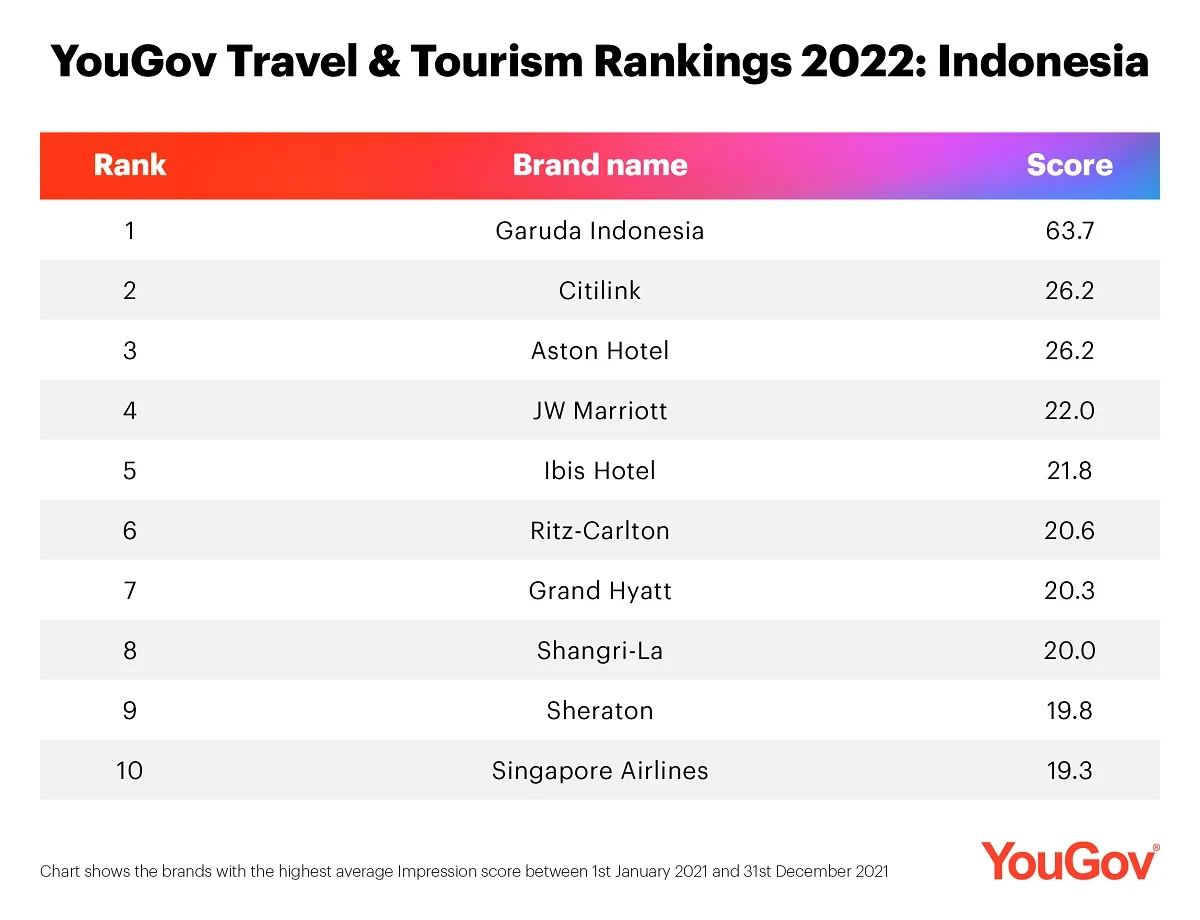
Following these local enterprises are luxury hotels JW Marriott (22.0), Ritz-Carlton (20.6), Grand Hyatt (20.3), Shangri-La (20.0) and Sheraton (19.8), as well as budget chain Ibis Hotel (21.8) in fifth place.
Rounding off the top ten is Singapore’s national carrier, Singapore Airlines, with an Impression score of 19.3.
Access the full rankings here.
Methodology:
The data included in the YouGov Travel & Tourism: Brand & Destination Rankings Report 2022 has been drawn from YouGov BrandIndex and YouGov DestinationIndex respectively. The markets included in this report are Australia, China, France, Germany, Indonesia, Japan, UAE, UK and US.
For the brand ranking, brands were ranked based on their Impression score, which is a measure of whether a consumer has a positive or negative impression of a brand calculated by taking the average net score for the year of 2021 (1st January 2021 – 31st December 2021). Consumers were asked “Which of the following brands do you have a positive impression of?”, then "Which of the following brands do you have a negative impression of?".
The brand rankings charts show those brands which received the highest average score. The scores are representative of the general population of adults 18+ for all markets (Indonesia and China are online representative).
All scores listed have been rounded to a single decimal place; however, we have used additional precision to assign ranks. All brands must be tracked for at least six months to be included in either ranking.